


Stock Market Primary III or IV Inflection Point Reached
Stock-Markets / Stock Markets 2014 Sep 07, 2014 - 03:43 AM GMTBy: Tony_Caldaro

 Summer holiday traders returned this week in the sell mode. Every new high, tuesday-thursday, was sold within the first hour and a half, or less, of trading. But the market managed to turn the tide on friday. For the week the SPX/DOW were +0.20%, the NDX/NAZ were +0.15%, and the DJ World index was +0.20%. On the economic front, positive and negative reports came in about even. On the uptick: ISM manufacturing/services, construction spending, factory orders, the unemployment rate, and the trade deficit improved. On the downtick: the ADP, payrolls, the WLEI, the monetary base, and weekly jobless claims rose. Next week we get a look at Consumer credit, Retail sales and Business inventories.
LONG TERM: bull market
For the past several months we have been tracking a subdividing Major wave 5 in the SPX. We had counted four Intermediate waves up into the recent early August low, and expected the next uptrend to conclude Intermediate wave v, Major 5 and Primary III. When the uptrend was confirmed we noticed two things about the correction that caught our attention. We posted these observations two weeks ago in the weekend update.
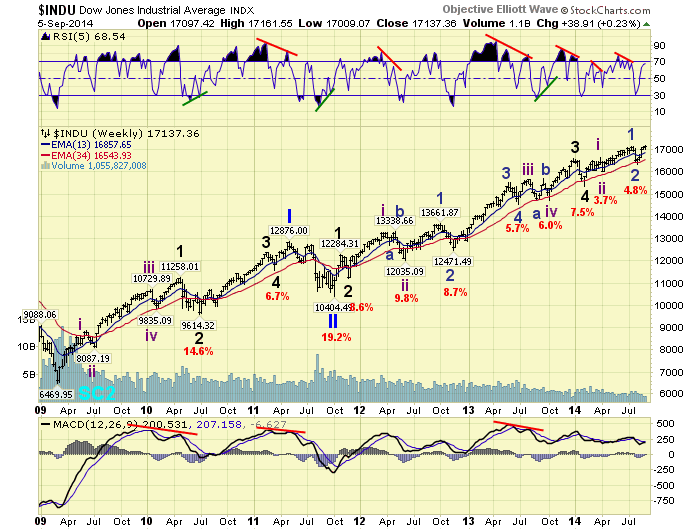
An exerpt: While we are maintaining our primary counts … We have noticed some deviations from what was expected during these past few months … The problems we are seeing are in the NAZ and the DOW. Since these two indices are key to our market observations, these deviations are worth noting.
You can read the entire posting, titled; “Potential Alternate Count” at the end of that weekend update: http://caldaro.wordpress.com/2014/08/23/weekend-update-462/.
This week Europe’s ECB announced their first QE program, naming it ABS. While the details were not released, we gathered from several sources that the program could be as large as $1.0 tn. This would be quite similar in size to the FED’s QE programs. As you know, the liquity of these programs has been the driving force that has taken the SPX/DOW to all time new highs. It is also a bit odd that the ECB is starting ABS, just when the FED is ending QE 3.
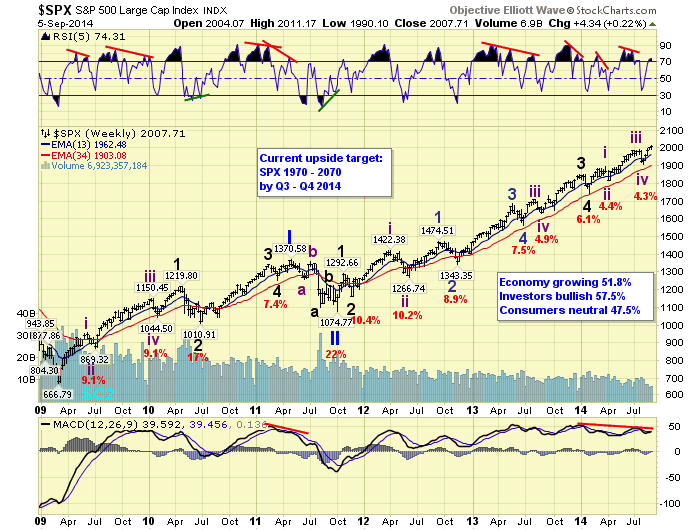
When we consider the recent patterns in the NAZ and DOW, and now the ECB’s QE. We have the ingredients for a potentially extending Primary wave III. The chart above displays the count we have been tracking for months, suggesting a Primary wave III high is near. The chart below is the count we offered two weeks ago, suggesting another extension for Primary wave III. Right now we give them equal weight.
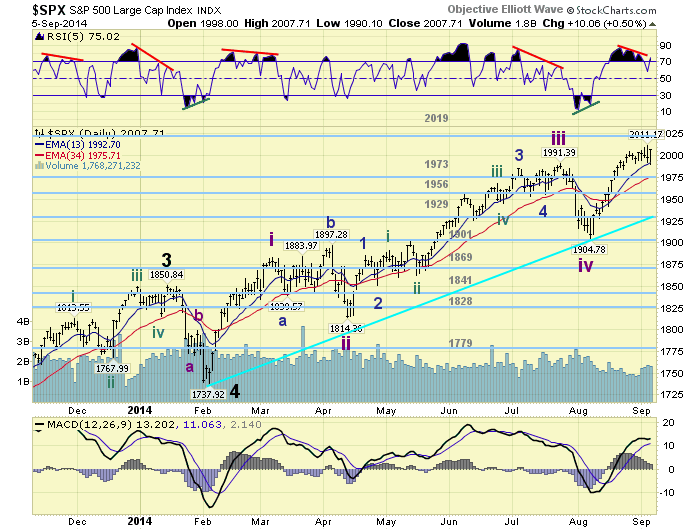
The key to this inflection point is the wave pattern. Since both patterns start from a Major wave 4 low in February, and have risen five waves up since then. The key level to watch is the August low at SPX 1905. Should the market fall below that low, Primary IV is underway. Should the market remain above that low, especially during the next correction, Primary III is extending. Therefore, the risk of remaining fully invested at this point is about 5% on the downside.
MEDIUM TERM: uptrend
The current uptrend began at SPX 1905 in early August. Thus far the market has rallied to SPX 2011 on thursday, and ended the week at 2008. While the four week rally has had a steep rise, similar to the February uptrend, it has run into some resistance lately. As of thursday we had counted five waves up from that low: 1945-1928-2005-1991-2011. The first wave was simple, the third divided into five waves, and the fifth was a diagonal triangle. At the high we had negative divergences on all time frames.
The market then pulled back to SPX 1990 on friday, the second largest pullback of the uptrend. But surprisingly rallied all the way back to SPX 2008 by the close. We believe the five waves up ended an impulse pattern of some degree. There is room, however, for a slightly higher high to complete this pattern with a slightly different short term count. In either case we would expect the OEW 2019 pivot to limit any further upside before the largest pullback of this uptrend unfolds.
If SPX 2011 was the high we would expect a pullback to either the OEW 1973 pivot, or the 1956 pivot. The first is a 38.2% retracement, the second a 50.0%. When we reach those levels the market will then have to decide if Primary III is over, or is extending. A larger pullback, especially below that rising trend line from 2012, would suggest Primary IV is underway. Holding one of those two pivots would suggest Primary III is extending. Medium term support is at the 1973 and 1956 pivots, with resistance at the 2019 and 2070 pivots.
SHORT TERM
Short term support is at SPX 1990 and the 1973 pivot, with resistance at SPX 2011 and the 2019 pivot. Short term momentum ended the week overbought.
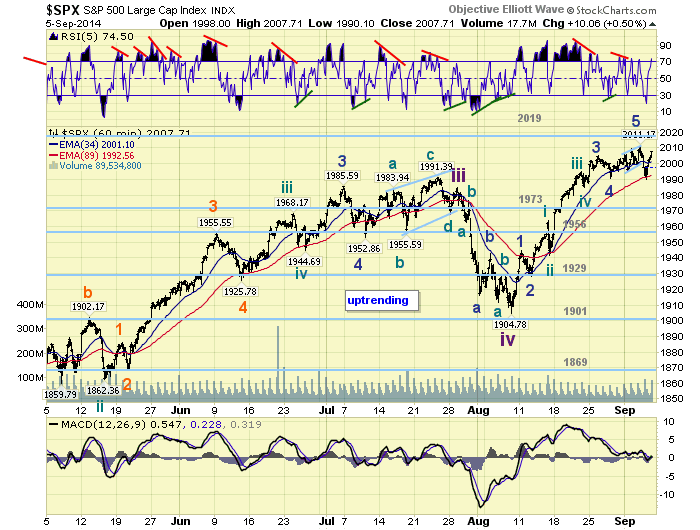
The short term wave pattern defined above is easily seem in the above chart. We labeled the recent high with a 5 to indicate that five waves had completed from SPX 1905. Since we are not completely sure what degree it was we will leave that labeling for now until the inflection point clears. Recent corrections, during Jan/Feb and July/Aug, have corrected about 50% of the previous uptrend. If they were a series of 1-2’s, as the alternate count suggests, then a 50% pullback of the recent SPX 1905-2011 rally would be quite normal. Another interesting juncture in this relentless bull market. Best to your trading!
FOREIGN MARKETS
Asian markets were mostly higher for a net gain of 1.4%.
European markets were all higher for a gain of 2.8%.
The Commodity equity group were mostly higher gaining 1.7%.
The DJ World index is uptrending and gained 0.2%.
COMMODITIES
Bonds continue to uptrend but lost 0.6% on the week.
Crude has been quite volatile this week, remains in a downtrend and lost 2.7%.
Gold is still downtrending losing 1.6% on the week.
The USD uptrend continues and it gained 1.3% on the week.
NEXT WEEK
Monday: Consumer credit at 3pm. Tuesday: Senate testimony by FED governor Tarullo. Wednesday: Wholesale inventories. Thursday: weekly Jobless claims and the Budget deficit. Friday: Retail sales, Export/Import prices, Consumer sentiment, and Business inventories. Best to your weekend and week!
CHARTS: http://stockcharts.com/public/1269446/tenpp
http://caldaroew.spaces.live.com
After about 40 years of investing in the markets one learns that the markets are constantly changing, not only in price, but in what drives the markets. In the 1960s, the Nifty Fifty were the leaders of the stock market. In the 1970s, stock selection using Technical Analysis was important, as the market stayed with a trading range for the entire decade. In the 1980s, the market finally broke out of it doldrums, as the DOW broke through 1100 in 1982, and launched the greatest bull market on record.
Sharing is an important aspect of a life. Over 100 people have joined our group, from all walks of life, covering twenty three countries across the globe. It's been the most fun I have ever had in the market. Sharing uncommon knowledge, with investors. In hope of aiding them in finding their financial independence.
Copyright © 2014 Tony Caldaro - All Rights Reserved Disclaimer: The above is a matter of opinion provided for general information purposes only and is not intended as investment advice. Information and analysis above are derived from sources and utilising methods believed to be reliable, but we cannot accept responsibility for any losses you may incur as a result of this analysis. Individuals should consult with their personal financial advisors.
Tony Caldaro Archive |
© 2005-2022 http://www.MarketOracle.co.uk - The Market Oracle is a FREE Daily Financial Markets Analysis & Forecasting online publication.