Can Gold Price Finally Recover?
Commodities / Gold and Silver 2014 Sep 17, 2014 - 01:00 PM GMTBy: Clif_Droke
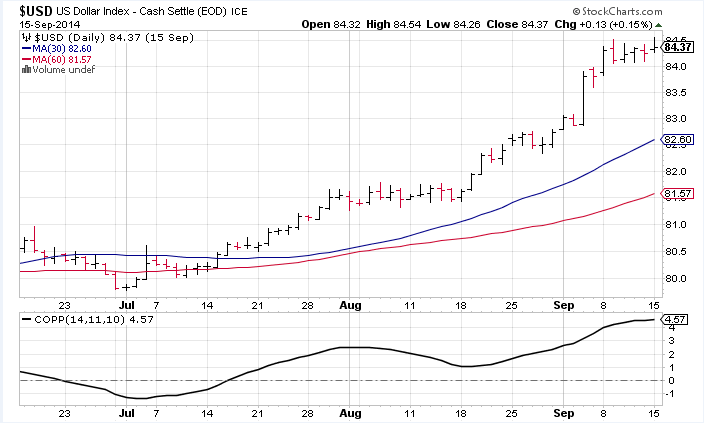
 Gold recently fell to its lowest level in seven-and-a-half months as the dollar rose to a 14-month high. Easing tensions in Ukraine and the Middle East also acted as a drag on gold and silver prices. Investors have been asking the obvious question as to whether gold can recover from here and if a bottom of at least short-term duration is imminent?
Dollar strength has been especially hard on the precious metals of late. Commodity prices in general have been beaten up in recent weeks by the surging U.S. dollar index, as sagging gold and silver prices attest.

Both the U.S. dollar and commodity prices in general are largely determined by the relative strength of the U.S. economy. With the economic recovery now in its fifth year, investors (especially foreign ones) are increasingly attracted to the U.S. as a safe haven. Economic weakness in the euro zone has galvanized a flow of "hot" foreign money to the U.S. dollar, further bolstering the dollar while at the same time depressing commodity prices.
Along with a strong dollar, another reason for the recent weakness in the gold ETFs has been a curious plunge in the level of short interest. For instance, the iShares Gold Trust (IAU) was the target of a large decline in short interest during the month of August despite a weak price trend.
As of August 15th, IAU short interest totaled 1.19 million shares, which represents a decline of 48 percent from the July 31 total of 2.29 million shares, according to Stock Ratings Network.com. Based on an average trading volume of 2.19 million shares, the days-to-cover ratio is currently 0.6 days.
Meanwhile ETF holdings for gold have continued to shrink with preliminary data for August revealing an outflow of 11 tons and flows in September have started the month off on a negative note at nine tons.
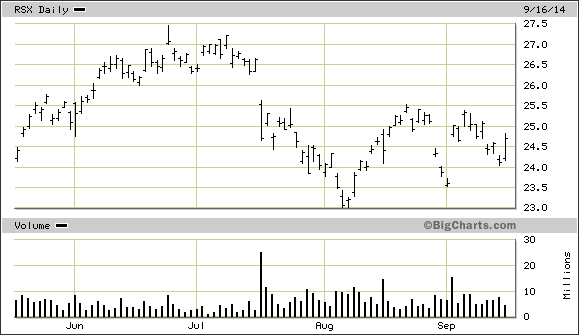
Earlier we examined the Market Vectors Russia ETF (RSX) for signs of a technical breakdown in Russia's stock market. A plunge in the RSX below the low from early August would suggest turmoil ahead for Russia on the Ukraine front, which in turn would be a major catalyst for gold bulls to charge. Lately, however, RSX has remained well above the August bottom as the cease-fire talk between Ukraine and Russia has gained momentum. As you can see in the following chart, RSX is now well above its August low of 23.00 and has bought itself at least a temporary reprieve. In turn, gold and silver have suffered as the safe haven trade unwinds.

More than perhaps any other factor, gold has been at the mercy of the macro environment, as Barclays recently observed. News from around the world hasn't done the gold price any favors lately as the yellow metal continues to search for a much-needed fear catalyst.
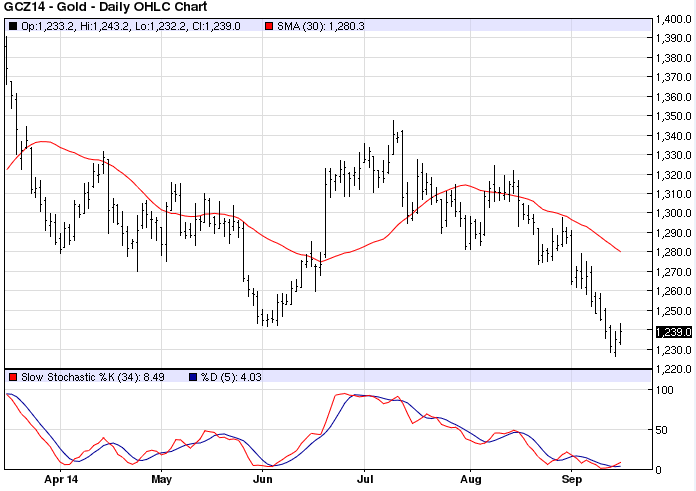
The December gold futures price has under-extended from the 30-day moving average by nearly 4 percent as of last week. This is significant since a long-term research history of gold shows that whenever price extends by approximately 4 percent above or below the 30-day MA, a technical reversal usually follows shortly thereafter. Gold is technically oversold on a short-term basis and is therefore vulnerable to a relief rally in the upcoming days. The extent and magnitude of the next relief rally, however, will depend in large measure on either a large short interest (which apparently doesn't exist right now) or else buying interest among institutions and hedge funds looking for bargains.

How to Read Chart Patterns
Stock traders have long known of the extraordinary profit potential that chart patterns can unlock. The ability to properly "read" a stock chart is an incomparable skill whose value can be limitless.
In the book "How to Read Chart Patterns for Greater Profits," I explain the method I've used to successfully forecast stock price movements for nearly 20 years as a professional. By combining both classical and unconventional chart reading techniques with market internal signals, a simple yet effective method for correctly anticipating stock price movements is obtained. Discover how the skill of chart reading can revolutionize your stock/ETF trading by ordering your copy.
Order today and receive an autographed copy along with a copy of the book, "The Best Strategies For Momentum Traders." Your order also includes a FREE 1-month trial subscription to the Momentum Strategies Report newsletter:
http://www.clifdroke.com/books/readingchartpatterns.mgi
By Clif Droke
www.clifdroke.com
Clif Droke is the editor of the daily Gold & Silver Stock Report. Published daily since 2002, the report provides forecasts and analysis of the leading gold, silver, uranium and energy stocks from a short-term technical standpoint. He is also the author of numerous books, including 'How to Read Chart Patterns for Greater Profits.' For more information visit www.clifdroke.com
Clif Droke Archive |
© 2005-2022 http://www.MarketOracle.co.uk - The Market Oracle is a FREE Daily Financial Markets Analysis & Forecasting online publication.


