The Gold Price Fuse has been Lit and the Rocket is Rising!
Commodities / Gold & Silver May 18, 2008 - 04:36 PM GMTBy: Peter_Degraaf
 Last week I wrote an article titled: “The Fuse Has Been Lit!” As a result of the article I received a number of E-mails from unbelievers.
It's amazing how many people out there still do not understand the basic bullish fundamentals of the gold market. Even a large number of analysts are providing their clients with erroneous advice, by telling them to ‘wait for a bottom'. Many of these clients could well be facing the problem of looking back ruefully at the bottom, long after it is in place.
In order for gold to drop, here are some of the things that need to happen:
• Several major gold discoveries need to be made in an area of the world where there are no rigid government regulations and no environmentalist groups, to slow down the building of a mine.
• South Africa needs to rapidly solve its power shortages.
• The rest of Africa needs to be able to supply ample power to the mines that are currently having problems obtaining enough power.
• Chinese people need to stop moving up from lower classes into the middle class, and must stop spending money on gold jewelry.
• The Chi-Coms need to stop buying gold for the treasury. (Currently almost all of the gold mined in China , remains inside the country).
• The Russian government needs to stop buying gold for the treasury. ( Russia is reaping the benefits of high oil and gas prices, and has nothing better to convert that money into than gold).
• The US Treasury needs to prove that the claimed 9,000 tonnes of gold that were last audited in 1953, still exist, and are not leased out.
• India needs to stop growing its economy, and needs to persuade its newlyweds not to ask for the ‘gift of gold'.
• Oil and gas prices need to drop.
• Food prices need to stabilize.
• The ongoing banking crisis needs to be solved, and the banking system must prove itself to be (not sound as a dollar – but), sound as gold.
• The world's central banks need to stop adding funds to the money supply.
• The Consumer Price Index, (real CPI– not fictitious numbers), needs to stop rising.
• The US government needs to balance the federal budget. (The Federal deficit for the first five months of f/yr 2007-2008 is -263 billion dollars, compared to -162 billion dollars during the same period the year before).
• Your neighbor, your brother-in-law and your shoe-shine boy must all be buying gold.
• Finally, AND THIS IS KEY: ‘Real interest rates' (T-bills less CPI) need to be positive by at least +2%. (They are currently negative by that much).
I've said this before, and it bears repeating: Build a file on your favorite analyst. Keep track of the recommendations. If he or she is wrong half the time, then why not flip a coin! Don't pay attention to an analysis that ends with ‘on the other hand'. Remember the words of President Harry S. Truman: “Just give me a one-armed economist.”
Charts courtesy www.stockcharts.com
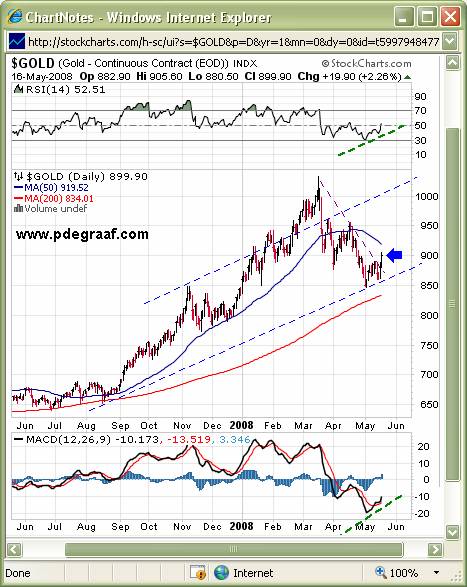
Featured is the daily gold chart. Price has broken out from beneath 2 months of resistance. This matches the length of the pull-back in Nov. and Dec. Price is now free to soar! The RSI and MACD have turned positive (green lines). The rocket is rising!
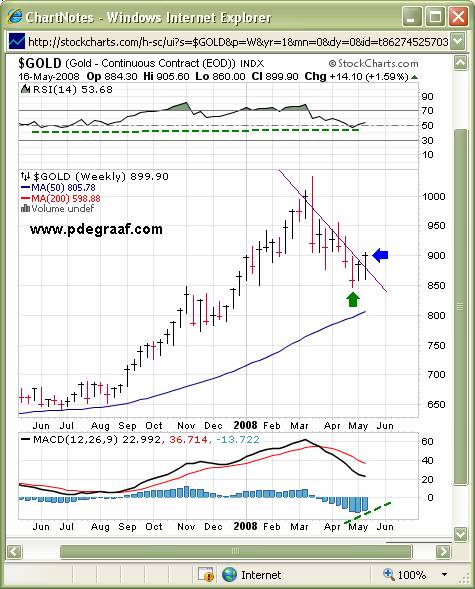
Featured is the weekly gold chart. Price closed above the purple line drawn through the closing prices of the previous 10 weeks, indicating a trend reversal. This is similar action to what happened the third week of December. The RSI is turning up from its support level, and the MACD is showing signs of bottoming. The rocket is rising!
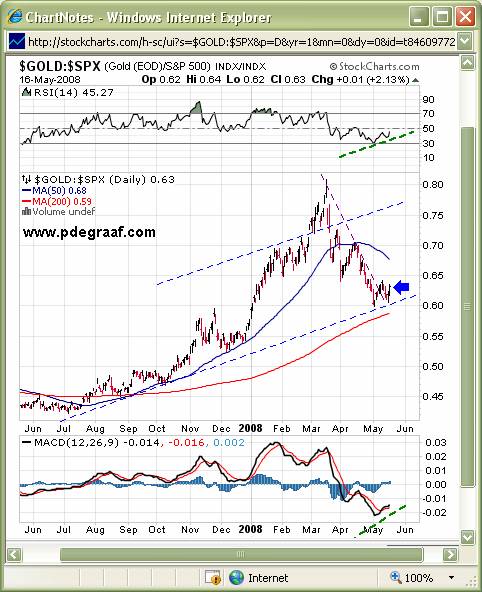
Featured is the index that compares gold to the S&P 500. For most of the past year gold has outperformed Wall St . This trend was temporarily reversed in mid-March. The trend is moving back to favor gold again. Price has just broken out from beneath two months of resistance, very close to the rising 200 day moving average. Millions of investors use the 200D as their ‘guiding light'. The RSI and MACD are turning positive, in oversold territory. The rocket is rising!
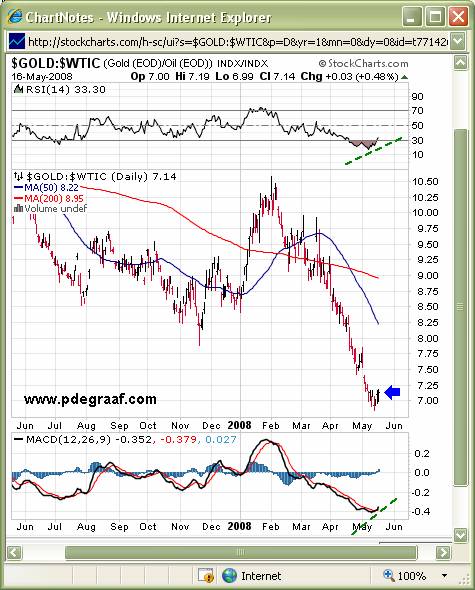
Featured is the index that compares gold to oil. Currently 7 barrels of oil will buy an ounce of gold. The historic ratio is 15.4 to 1. Presently 25% below the 200 day moving average, the ratio is showing that it is ready to reverse (blue arrow). In the past, whenever the ratio was this low, the pendulum effect caused it to double from its low point. The anticipated target therefore is 14 to 1. The message from this chart is to sell oil and buy gold. The RSI and MACD are turning positive in oversold territory. The rocket is rising!
======================================================
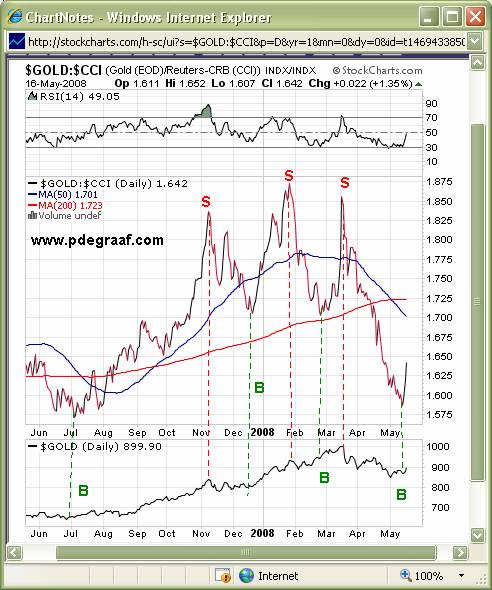
Our last chart compares gold to the CCI commodity index. A lot of traders use this index to determine when to buy or sell gold, as it has a good predictive record. The first cycle shown here (from Buy to Sell) took gold from 650 to 835. The second cycle went from 800 – 925. The third cycle took gold from 950 – 1010. The fourth cycle is just getting underway! The RSI is rising up from the support level at 30. The rocket is rising!
==========================================================
Summary:
Since no one can tell you exactly where or when a bottom is in place, until long after the fact, the best method you can employ is to buy gold whenever the price has dropped for a few days. Then, if you are an active trader, take some partial profits whenever you think gold is temporarily ‘overpriced.' Never short a bull market! Gold has barely begun its ascent, especially when compared to some other metals such as lead (up 500%), uranium (up 530%), copper (up 470%), molybdenum (up 1,300%), and rhodium (up 2,200%).
This bull market has many years left ahead of it, in spite of the best efforts of the central banks that are trying to keep the price down, in order for the masses to believe that fiat currencies are safe. I saw them try that game in the 1960's when they were trying to hold gold down at 35.00. Look at how badly they lost that battle!
By Peter Degraaf.
Peter Degraaf is an on-line stock trader, with over 50 years of investing experience. He issues a weekly alert to his subscribers. For a 60 day free trial, send him an E-mail itiswell@cogeco.net , or visit his website www.pdegraaf.com
DISCLAIMER: Please do your own due diligence. I am NOT responsible for your trading decisions.
Peter Degraaf Archive |
© 2005-2022 http://www.MarketOracle.co.uk - The Market Oracle is a FREE Daily Financial Markets Analysis & Forecasting online publication.


