


Stock Market S&P, NAS Change In Trend? None Apparent, But A Caveat
Stock-Markets / Stock Markets 2014 Sep 29, 2014 - 10:54 AM GMTBy: Michael_Noonan

 There have been no articles here on the stock market since last February, Fat Lady Has Yet To Sing. Some Questions About YOUR Stocks? A half-year later, there has still been no singing, but the questions about how profitable any of your stock holdings are is still very much pertinent ones to address. If any of your stock holdings have not increased at a rate proportionate to the averages of the indices, that could be a huge warning that should not go unheeded.
We have shunned the stock market due to the takeover by the Federal Reserve, to put it bluntly. The central bankers have also been on the short-side of gold and silver in their overt efforts to eliminate any competition to their fiat paper currency Ponzi scheme. As we refuse to participate and short PMs, due to central bank efforts, for the same reason, we opted out of the long side of the stock market, except for a recent, very brief occasion.
What we know for certain is that over the past four years, many trusted and reliable stock blogs have been salivating over and calling for the top of the market. We stopped looking at all stock sites a few years ago. The simplicity of just following the trend was and has not been in vogue with most traders.
A review of what the market has to say, these days, seems relevant. While the larger time frames are not saying a top has occurred, the up trends remain intact, it may be worth considering that a topping process may be near, and they can take several months to develop. That said, there is no need to be looking at the short side of the market, yet, but staying long without substantial profits in existing holdings could be an invitation for a reduction in one's net worth.
The number of quality, leadership stocks keeps getting smaller and smaller, and when the leadership stocks are having difficulty showing a profit in such a protracted up trending market, lesser quality stocks will be unable to sustain their current price levels. This is our caveat to being long in the stock market. Not many paid heed to the market turn in 2007, with "last call" in 2008, but when the market turned it did not look back until it had pared over 50% of its gains, on average. Many stocks simply never survived.
When viewing the top in 2007, it did not look ominous, and the same can be said of the current market conditions, not suggesting a top is in play. The point is, people would not pay attention. Back then, there were more individuals in the market. That does not hold true for today. It is more professionally dominated. Professionals deal in large size. Any sustained turn lower would mean a stampede of huge orders, and the next decline, when it starts, could be more severe than 2008.
Our point? Better a year early that a day late.
A look at the charts and what the best and most reliable source, the market itself, has to say:
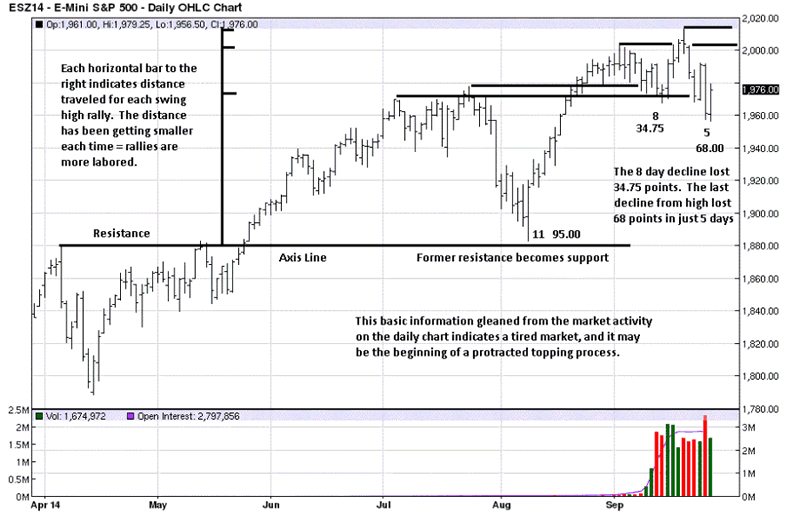
Normally, we start with the higher time frames and work lower. The daily comes first because many remain focused on looking for a top to sell. There are signs of concern over the last several days of trading, but the Fed's market has shown even greater EDM [Ease of Downward Movement] in the past and was able to make new highs, [see July/August].
Here are our reasons for sounding a caution bell, [emphasis on the word caution]. The net gains have been diminishing over the last several months. The vertical bar on the left side of the chart shows how the gains have been smaller, but it is not enough over which to be concerned, at this point. Price is at the high of a very long bull move, yet not all stocks have shown gains commensurate with the rise.
Many stocks are not even showing profitable growth. The NAS, or tech sector, has been doing its share of IPOs with stocks that have no income, only potential promise of growth. Shades of 2007, when the NAS was making higher highs, speculators making money with day trading the rage, yet most of the stocks composing the index were not profitable for the year. If one were to step back from the feeding frenzy to make easy money, the situation then did not make financial sense.
Given how the Fed has been supporting this market, muscling it up for the past few years, the poor economy, lack of growth, people out of work, depending on part-time jobs to make a living, trillions of dollars in debt and growing, the velocity of money at a stand- still, just like the economy, the current situation does not make financial sense now, either. But that is just our opinion. The market always has the final say.
The high of the move, 6 bars ago, is a red flag, at least until, or if it is negated. What that bar says is, price made a new high, but it closed under the opening and slightly lower than the day before. New market highs, and price closes lower on a bar that has a relatively small range? Volume increased on that down day [red vol bar, 6th from the right]. Look at the high volume buy bars just to the left, when buyers were in control. Sellers won the battle that day. Where are all the buyers at the highs?
The market activity is based on logic. You need not be a "technical analyst" to follow what information the market is conveying. So follow along based on deductive reasoning and nothing else. Compare the volume of the two highest up days [green bars], with the vol of the two down days [red bars], following the top. Volume = effort. Relative to the 2 up bars in higher volume, price was able to sell off and erase the previous gains on much less volume, effort.
At a point, all time highs, where buyers should be in control, sellers are having an easier time moving the market lower. From a common sense perspective, does it make sense? Maybe, when put in context with the lack of net gain as depicted on the left side of the chart. [Maybe is not a sufficient reason for making an informed decision.]
On Wednesday, 3rd bar from right, price rallied and closed strongly on slightly less vol, as it should in an up trend. On Thursday, look at the sharp increase in volume and how easily the market sold off. The market is having some issues here. Not enough to say the trend has turn, but enough to give consideration to the potential of a topping process.
The loss in points over the last 5 TDs [Trading Days], was twice the previous down swing loss over an 8 day period. Twice the loss in almost half the time after new highs is a message from the market. The exact meaning of the message may not be known until after the fact, in hind-sight, but the red flag is given in present tense and can be acted upon in a defensive manner.
Price made a lower swing low, Friday. If the next rally does not make a new high but leaves behind a lower swing high, the daily trend will be in the process of changing. The change may be from an up trend to a sideways trend, there is no way of knowing. All one can know is that the market is sending messages, and with experience with messages from past market conditions, it is important information.
Is the stock market putting in a top? The answer to that is the same as we have been saying for the past 4 years: not yet, or at least not confirmed. There are many who have been trying to sell a market top for the past few years, without waiting for confirmation, and their "tuition bills" for trying to be ahead of the market instead of following it, have been high with nothing but losses.
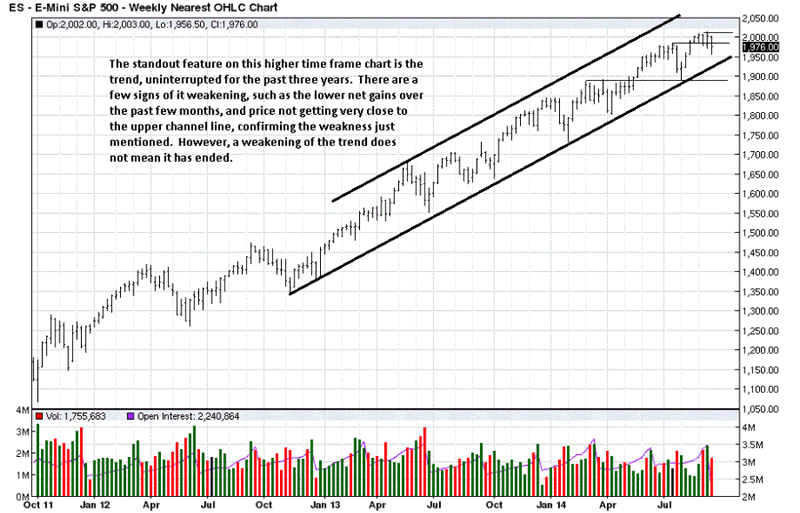
It is clear that the trend is higher and uninterrupted on this higher time frame weekly chart, and the potential issues addressed on the daily are almost of no concern here, with the exception of the weakening of upward momentum denoted by the thin horizontal lines off the swing highs.
What makes the shorting of net gains more meaningful as a possible red flag on his chart is the synergy with the same observation on the daily. The more congruence that exists between different time frames, the more reliable are the potential signals being given by the market.
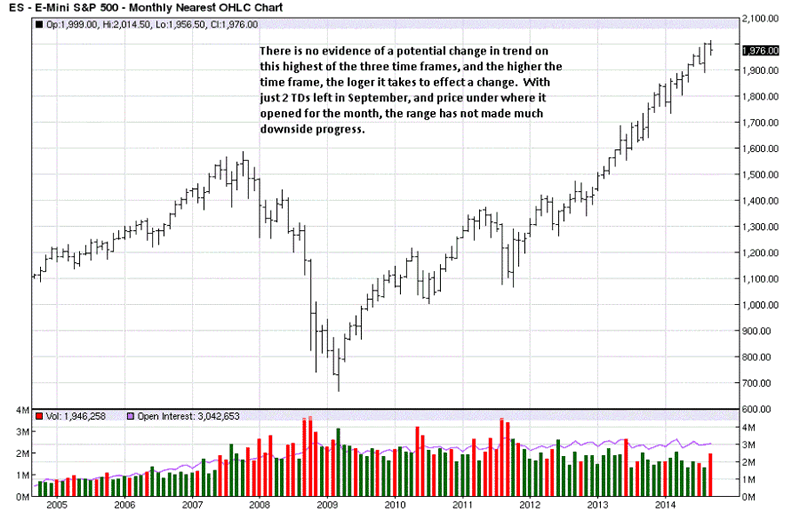
On the highest of the three time frames, it is way too soon to suggest there is any potential topping activity taking place in the market. However, one has to keep in mind that the higher time frames are not used for market timing. Changes of trend take place on lower time frames well in advance of changes on the higher time frames.
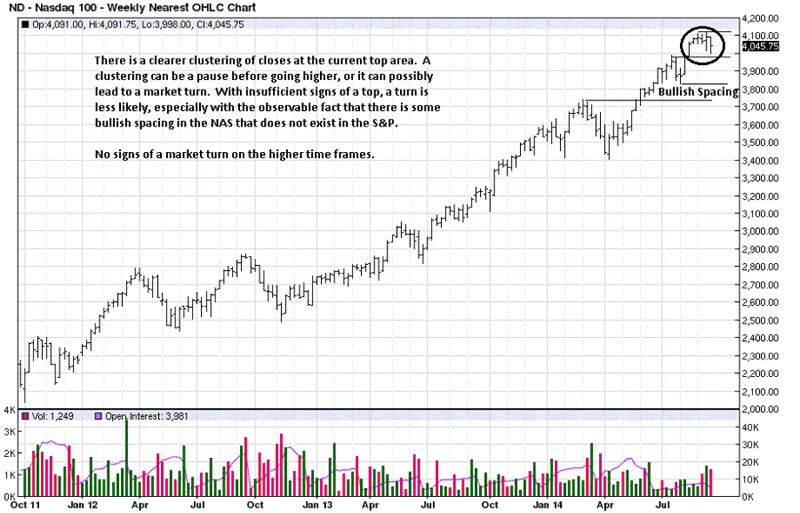
The daily NAS chart has nowhere near the volume of the S&P, so we do not show it. What is of interest is the clustering of closes combined with the bullish spacing. Without the Bullish Spacing [there is a gap between the last swing low made in August, and the last swing high from February], we might view the clustering of closes with a little more of a caution due to the read on the S&P e-mini daily chart.
There is one more observation that adds to the qualified caution of the clustering of closes, as noted, and that is the wide range bar, strong close on increased volume from two weeks ago. There was no further upside follow through. Offsetting that, to some degree, is last week's lower close, but the location of the close is mid-range the bar, and that tells us buyers were active at the lows, preventing price from closing lower than it did.
The market is constantly giving off pieces of information like we have been discussing.
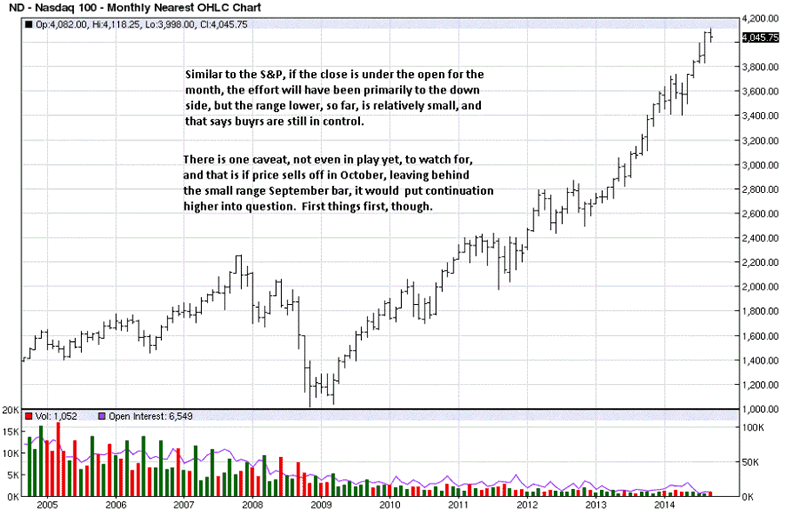
Comments on the chart are clear and need not be repeated.
The market is full of these bits of information. It is a matter of knowing how to read the messages, an art more than a science, but at times there are clear patterns that repeat over and over, and if you pay attention to these market distinctions, knowing what to do and when becomes a lot easier, and it eliminates guesswork. It does not guarantee a profit to anyone, [there are no guarantees], but it gives one an incredible edge in the likelihood of being in sync with developing market activity, and that is where the money is made.
Just follow the market's lead.
By Michael Noonan
Michael Noonan, mn@edgetraderplus.com, is a Chicago-based trader with over 30 years in the business. His sole approach to analysis is derived from developing market pattern behavior, found in the form of Price, Volume, and Time, and it is generated from the best source possible, the market itself.
© 2014 Copyright Michael Noonan - All Rights Reserved Disclaimer: The above is a matter of opinion provided for general information purposes only and is not intended as investment advice. Information and analysis above are derived from sources and utilising methods believed to be reliable, but we cannot accept responsibility for any losses you may incur as a result of this analysis. Individuals should consult with their personal financial advisors.
Michael Noonan Archive |
© 2005-2022 http://www.MarketOracle.co.uk - The Market Oracle is a FREE Daily Financial Markets Analysis & Forecasting online publication.