Gold and Silver Stocks Apocalypse Now, Bear Market Review
Commodities / Gold and Silver Stocks 2014 Oct 08, 2014 - 05:13 PM GMT In part I, Phase III-Dead Ahead, we established the macro case for the final phase of the gold stock bear market. As the bear market progresses the economies key constraint remains the level of debt, specifically the size and composition of the national balance sheet which has baked in the cake a deflationary outcome. It is this wave of deflation that will drive the final phase of this bear market to unimagined lows. The good news, however is when it's finally over the precious metals will transition into the next bull market. We will examine this process and the sign posts along the way as we complete phase III of the bear market and transition into the beginning of the next bull market in the precious metals.
Bear Market review
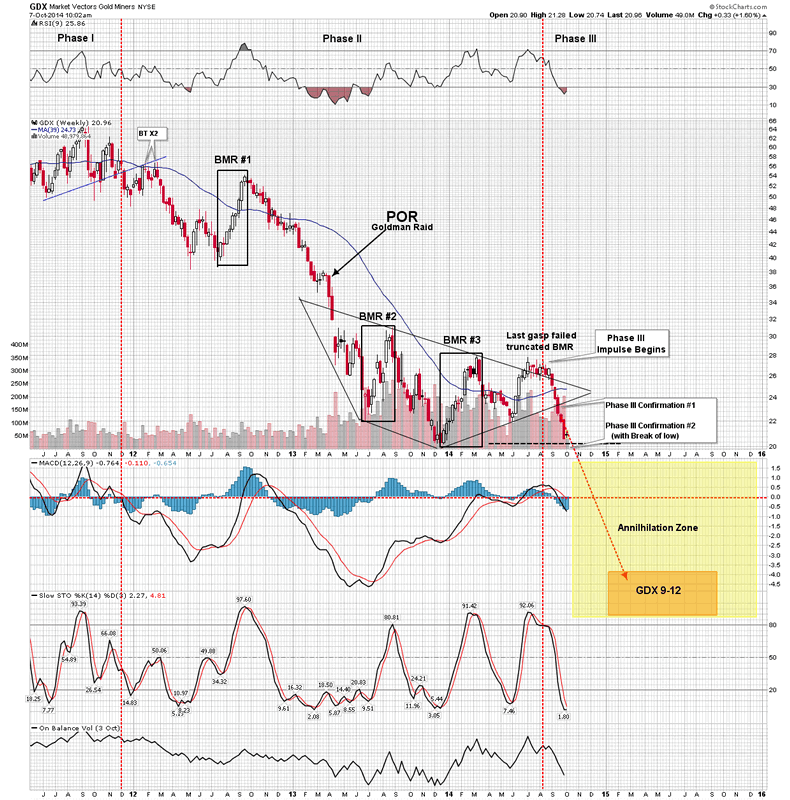
This precious metals bear market is following the classic bear market sequence. After breaking down out of its phase I top it entered into a long protracted decline. This decline, over time, established doubt that we were simply in a pull back in an ongoing bull market. This phase II price erosion lasting 17 months, diminished investors conviction sufficiently so to make them ripe for a psychological change. This change event was triggered with the April 2013 Goldman bear raid of the gold market. This raid collectively triggered the point of recognition (POR) among investors that the precious metals sector was in a bear market. It took 20 months from the Sept 2011 top to reach this point. Prior to this point the prevailing belief was we were still in a bull market. The PM market then underwent dual crashes in April and June 2013 which was the process of pricing in the recent shift in investor psychology. Since this period the market has taken 16 months to consolidate these crashes by undergoing a complex diamond consolidation pattern all within the context of phase II. It now appears this process is complete and is now entering into the final phase III of the bear market. This is the classic pattern of a bear market as I outlined in a previous essay:
Bear Market Phases
Three Phases of a bear market
Phase III-The trap door swings open
The 16 month phase II midpoint consolidation is now over and phase III has now begun. The final phase of the bear market was initiated on August 14 2014 with a downward impulse in the price action. This move will be confirmed when it violates last December's HUI low of 189. When gold closes below the previous low of 1185 there will no longer be any denying that this bear is still ongoing. Previous hopes that we have been in a nascent rally in a new bull market will disappear like a desert mirage. That's when the trap door flies open. Gold bugs who have endured three years of pain clinging to their newsletter writers confident assurances will finally lose grip. All but the most delusional will be forced to confront the bald faced reality that these prophets calling bottoms for the past three years are delusional themselves. After the market's 80% plus declines and advisors making serial bottom calls, followed by predictions of quick new highs, the faithful will finally start waking up. Yes, sometimes it does require a 2X4 to the side of the head. Recalling the quote of Charles Mackay in his book Extraordinary Popular Delusions and the Madness of Crowds "Men, it has been well said, think in herds; it will be seen that they go mad in herds, while they only recover their senses slowly, one by one." Many will come to see their own behavior after a 10 year bull market in gold which ended in 2011 in a similar light. After 10 years of extraordinary gains many took leave of their senses and could no longer see the economic realities which had brought an end to this exceptional bull market. Soon as the gold bear market continues lower it will be seen as a bottomless pit and many will finally give up and lose the faith, while others will undergo forced liquidation. It would be timely to review the description of the psychological state of affairs of phase III which I described in Phase III- the annihilation under the section called "The Horror". Let's just say its about to get ugly.
Phase III Annihilation-The Horror
The Purging
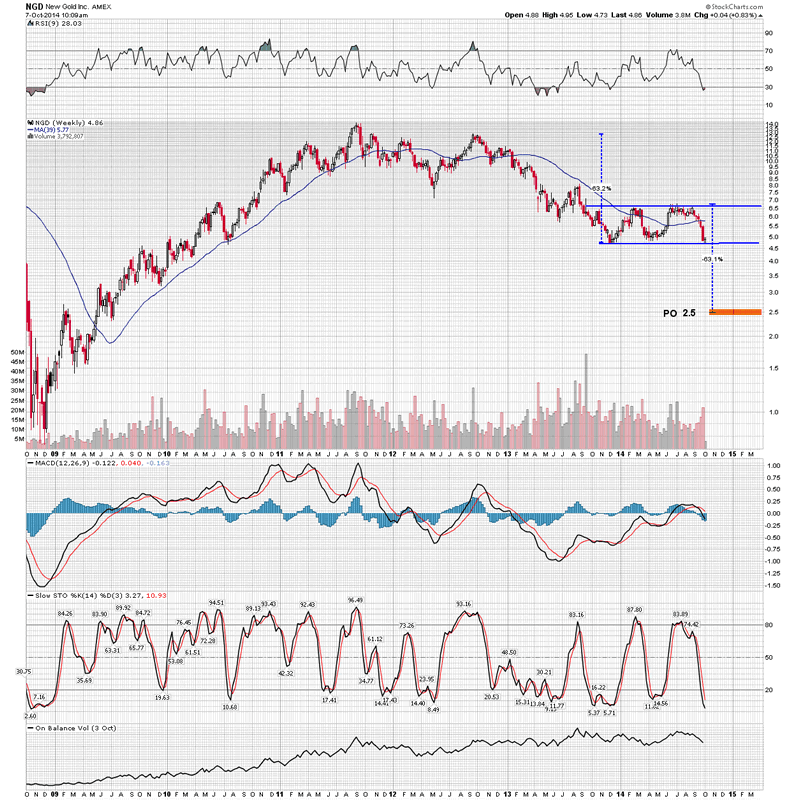
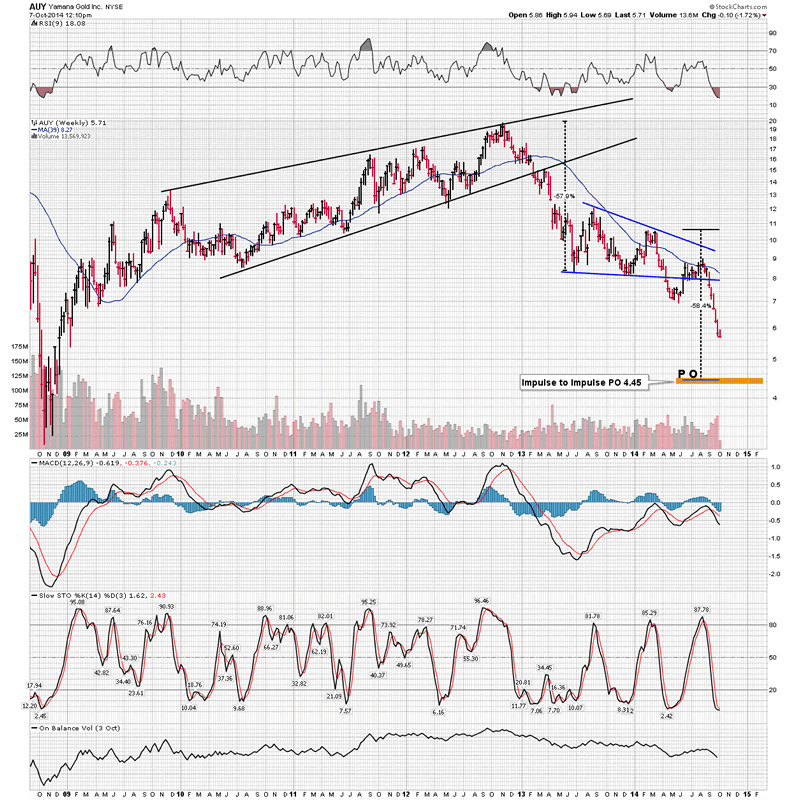
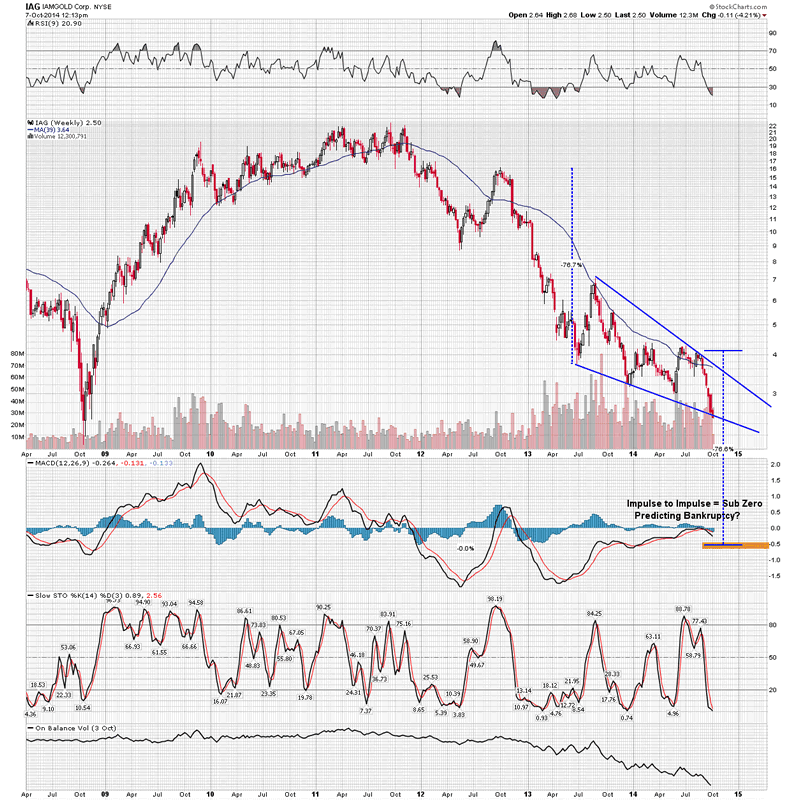
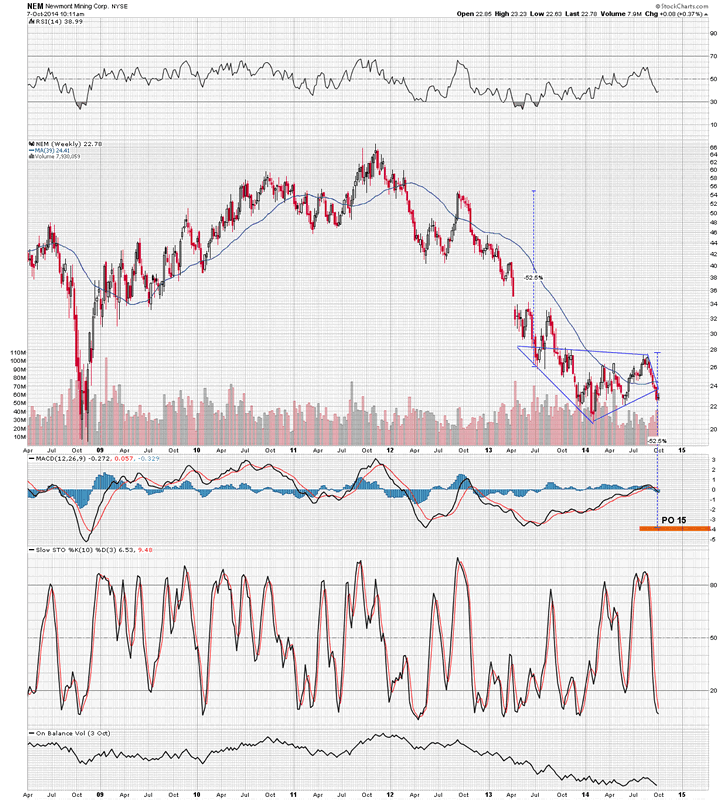
In Phase III, bear market rallies fueled by hope are now a thing of the past, instead we will have vertical short covering rallies that quickly flame out. Phase III is no longer about hope it is now about survival. In a word, it is now serious, as rallies will be used as a means to secure liquidity. The purging will be so relentless that the belief in the ultimate safety of gold will be converted to skepticism among many. It is precisely this doubtful state of mind that will nag the first phase of the next bull market once it begins. The collapse in stock prices will finally clear the market as rock bottom prices will allow corporate acquisitions and restructurings. Uneconomic projects or "malinvestments" will be jettisoned, low grade, high altitude orebodies in far off, forsaken countries written off for good. Balance sheets will be de-levered, bad debts written off. This purging of the excesses of the past 10 years will lay the foundation for the upcoming bull market in precious metals. Here are some selected price objectives during phase III:
The Gold Bug - Providing raw fuel for Phase III.
For metal stocks to drop another 20-50% from their current depressed levels there would have to be a renewed supply of "motivated sellers". After the purging we have already seen to date, it would be fair to ask, are there any more sellers left? Could there still be enough sellers willing to provide the supply needed at much lower prices? With sentiment already this low hasn't everyone who wants out, exited already? Well, the gold and silver market has been holding in reserve a special class of long term investors who can be called upon to dump their shares at the most inappropriate moment. In a final liquidity seeking event many will find the need to rid themselves of shares they swore to keep through thick and thin. Enter the goldbug-the raw fuel for a phase III.
Lloyd the goldbug- Raw fuel personified
Let me tell an anecdotal story of Lloyd, the gold bug. This summer while attending a mining investment conference I went on a mine visit. Lloyd, an attendee on our tour, was the quintessential goldbug. He was a friendly fellow who didn't hesitate to tell me his opinion of the state of the world and its markets. Throughout the day I prodded Lloyd with questions and just let him talk, by the end of the day I had certainly gotten an earful. He covered the gambit of topics from FED money printing to market manipulation. Lloyd was quite certain he knew how this was all going to work out in a grand hyper-inflationary blow off which would carry gold and gold stocks to extraordinary levels. When I asked him how much lower metal stocks could go he assured me of two things. "Not much lower and I can guarantee you that once they bottom the price will rocket straight up to record highs." It didn't take me long to realize that three years into a bear market Lloyd was still "all in". Lloyd was in his mid-60's and just entering retirement. At some point during the afternoon he asked me if I would be interested in buying his undeveloped lot at Doug Casey's Cafayate retreat. It became obvious to me that Lloyd was already "seeking liquidity" as I realized this was the kind of guy who is going to throw in the towel and sell whatever was liquid when phase III comes along. He was already nearing the end of his rope and he was the classic candidate that I described in my essay Phase III- Annihilation in the Precious metals markets where I stated: "Phase III is not about hope it is about liquidation...Long term holders are forced to act in a bid to salvage what they have, unable to risk further declines and possibly end up retiring in poverty, the pain becomes too great, thus the selling orgy commences". So could there possibly be any sellers left to power phase III lower?...yes unfortunately there are.
Step Sum update
The step sum is a sentiment indicator which simply tracks a cumulative number of up vs. down days. The step sum typically lags the price action in phase I of a bull market and phase III of a bear market. This is because investor psychology is normally slow to acknowledge the market trend in these two phases. Once they do collectively recognize the trend however, the step sum has a final and rapid movement to meet price. This is a form of capitulation in both bull and bear markets. In the 20 year gold bear market which began in 1980 the step sum stubbornly resisted golds decline for 17 years. Once the bear entered phase III however, the step sum began its collapse reflecting this psychology of capitulation. By the time gold finally bottomed the step sum had caught up to the price of gold and they bottomed together.
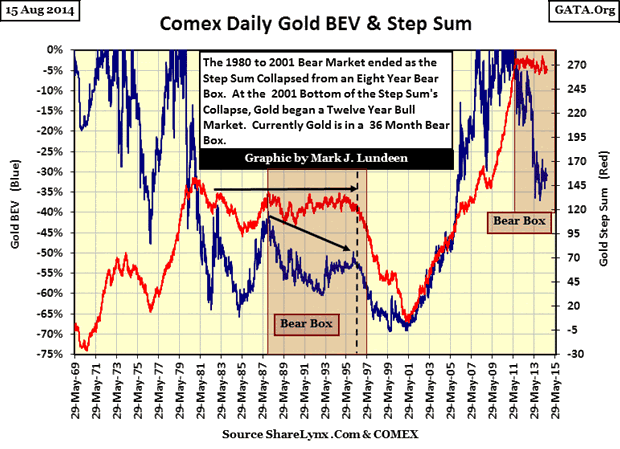
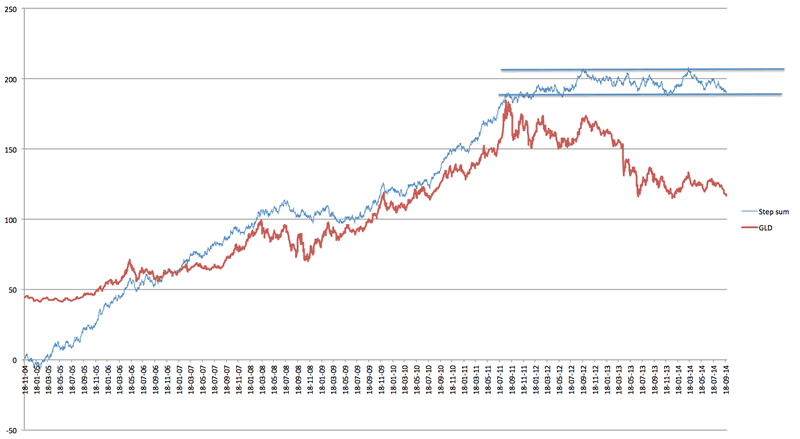
Today we see the step sum has not yet begun its decent. Historical precedent indicates the bear will not be over until the step sum collapses towards its price. That would require the loss of greater than 100 points which normally requires a protracted decline of extended duration.
Road markers to the Bang Point
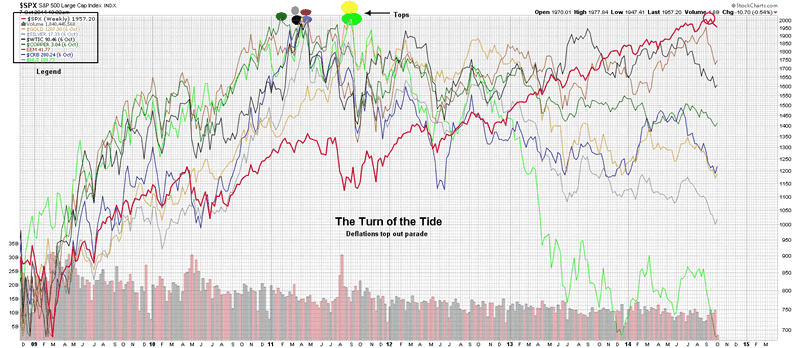
The bear market in precious metals is a function of the debt which is driving deflation. The inflationary winds are no longer filling the sails of gold and silver. The rules of the 1970's no longer apply as we have passed the inflection point where more debt and spending will drive inflation. The transition year appears to have been 2011 as it marked a change in the relationship between the USD and other asset classes. Just as when William P. Hamilton penned his article in the WSJ on October 25 1929 titled "A Turn of the Tide" which declared the beginning of the bear market of the great depression, today's shift in trend between the USD and the metals in 2011 was our modern equivalent. This transition signaled the emergence of deflation and the beginning of the bear market in gold and silver yet very few recognized it for what it was. Let's now look at some road markers that have already passed and others yet to come on our path towards the bang point, which is the point the government can no longer roll over its debt.
Dominoes falling in sequence- The top out parade
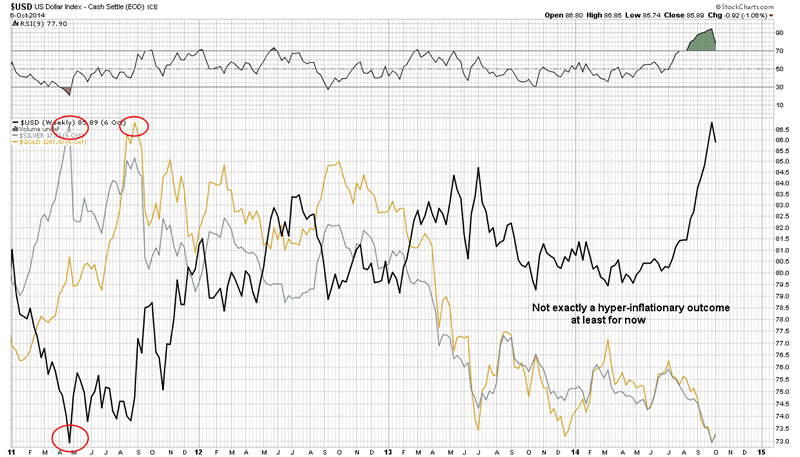
The main driver of the gold bull market was the fear of central bank money printing and the resultant risk of hyperinflation. Since 2011 however, this inflation scenario has failed to materialize thus removing the main thrust behind gold and silver's rise. Silver topped and the USD bottomed the same week in April 2011, few made the connection that this was announcing the emergence of deflation. Gold went on to top later that September. The year 2011 was in fact a top out parade of assets that normally perform well in an inflationary environment. We saw Copper, Emerging markets, commodities, and the king of commodities, crude oil top out in that year. Since 2011 this trend has remained intact and recently began accelerating, despite all the money printing by the FED and central banks. Clearly, with the FED's stated objective to produce inflation this trend indicates something else is afoot. The inflationary winds have now shifted and instead of filling gold and silvers sails they are now providing a stiff headwind. These winds are now set to propel gold stocks into a downward impulse while the breakout of the USD indicates the triumph of deflation.
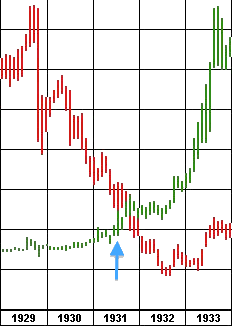
To recognize the markers ahead which lead to the bang point in this debt cycle let's first examine previous cycles. In 1928 the Fed began the process of pricking the speculative bubble which they fueled throughout the decade. In Feb 1928 the discount rate stood at 3.5% and they began to raise it until reaching 6.0% in Aug 1929. As the economy then faltered the market soon crashed in October 1929. This crash was a recognition that the world was being forced into a deflationary era where credit levels were no longer sustainable. For the next year, as the stock market declined and deflation took hold both corporate and treasury bonds rallied as their yields declined reflecting a slowing economy. In Sept 1930 however, corporate yields started to rise despite deflation becoming more entrenched. Rates rose due to concerns over the solvency of the corporations underwriting those bonds. Government treasuries however, continued their rally for another year, until the banking crisis of May 1931 triggered by the failure of the Credit Anstalt bank in Austria. This seminal event converted the economic contraction into the great depression we call it today. At this point, even US Treasury yields began to rise due to solvency concerns. Long-term treasury yields rose 35% over the next 10 months peaking during the banking crisis of 1932 (see chart). The price of gold was then increased by 70% to counter deflation and the bull market in gold stocks was well on its way being fueled by both a higher gold price and lower input costs.
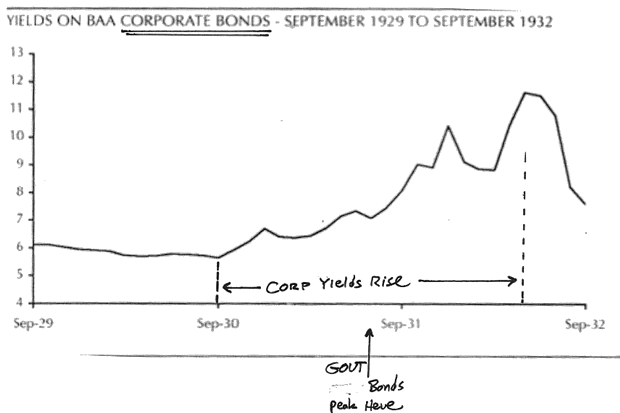
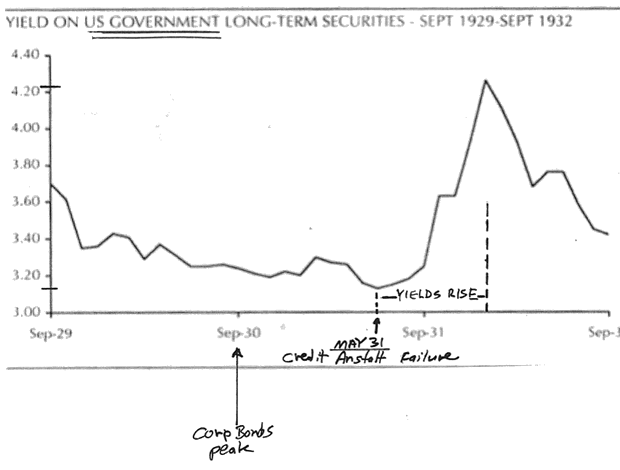
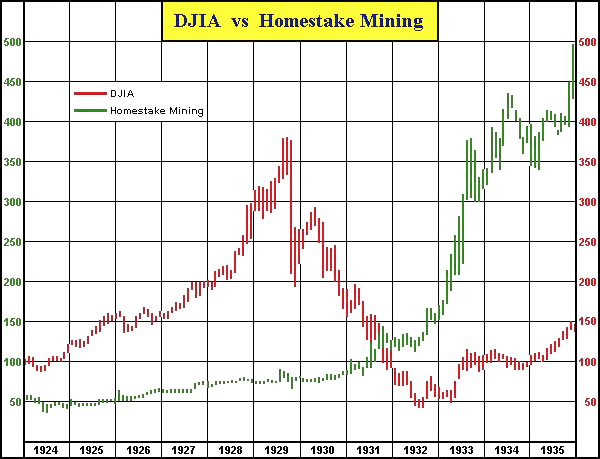
The impact of these events can be seen in the performance of Homestake mining, a good proxy for the producing miners. The stock price of Homestake declined about 20% in the fall 29 crash, but then stabilized and began a slow ascent over the next 17 months while the Dow entered its long bear market. When corporate bond yields started to rise in Sept 1930 reflecting credit stress, Homestake started its rise. Over the next 9 months the stock rose 30% as the Dow fell. The stock then took a hit along with the rest of the market during the banking crisis in the summer of 1931. As government treasury bond yields began rising due to solvency concerns Homestake stock began its surge. This was the classic case of gold stocks performing well in a post bubble contraction where input cost decline while gold becomes a safe haven. Government debt was no longer considered the premier safety asset and gold was performing its time honored role as a currency with no counter party risk. It had become a magnet for liquidity and was acting as a sound currency and safe haven. This was the path which led to the gold stock bull market of the 1930s and could be a guide to what lies ahead for us today
Silver & Gold the ultimate canaries
Both silver and gold have been the first assets to sniff out the deflationary turn of the tide. In effect they have been the canary in the economies coal mine, a sort of first responders indicator. Since silver no longer retains its monetary element and is chiefly an industrial metal, it makes sense it peaked 5 months before gold. As we progress towards the bang point I suspect gold particularly will respond by bottoming and begin its advance. That will be the beginning of the next bull market in the precious metals.
In the next and final segment-part 3 we will examine a portfolio to navigate the upcoming market minefield. How do we survive the phase III annihilation and successfully transition to the next bull market. How long will it take? What assets should we own? The ideas will surprise you and are based on sound historical precedence. You should ask yourself has your market guru been advising you to buy all the way down from the highs of 2011? If so, don't you think its time to re examine your premise?
Plunger
(Associate Writer and Market Historian for Rambus Chartology)
To Contact the Author: gmag@live.ca
All the best
Gary (for Rambus Chartology)
FREE TRIAL - http://rambus1.com/?page_id=10
© 2014 Copyright Rambus- All Rights Reserved
Disclaimer: The above is a matter of opinion provided for general information purposes only and is not intended as investment advice. Information and analysis above are derived from sources and utilising methods believed to be reliable, but we cannot accept responsibility for any losses you may incur as a result of this analysis. Individuals should consult with their personal financial advisors.
© 2005-2022 http://www.MarketOracle.co.uk - The Market Oracle is a FREE Daily Financial Markets Analysis & Forecasting online publication.


