Forget What Stock Market Analysts Say, Both of These Omens Mean Big Profits
Stock-Markets / Stock Markets 2014 Oct 10, 2014 - 03:26 PM GMTBy: Money_Morning
 Sid Riggs writes: It's been 14 trading sessions since the financial media was abuzz with the fact that the Russell 2000 Index experienced a Death Cross. That is to say, its 50-day simple moving average (SMA) trended below its 200-day SMA. The coverage was all about why the Death Cross spelled impending doom for small-cap stocks and, by extension, the entire stock market.
In fact, in all of the Death Cross commentary I saw on television and read on the Internet there was no mention of historical performance after a Death Cross. None! Just a lot of hyperbole about why we should be concerned.
Indeed, instead of even the most basic statistics, all the well-spoken analysts, well-dressed pundits, and market commentators just kept showing chart screenshots of the current market condition as a reason why we should all hunker down for a correction.
Basically, a sample set of one.
And as you remember from Statistics 101, a sample set of one means absolutely nothing! It's not's even really a set because a set implies at least two data points.
The lack of statistical support raised quite a few questions about the actual performance of stocks following instances of a Death Cross and the Golden Cross - when the 50-day SMA trends above the 200-day SMA.
So, I took it upon myself to do myth-busting, and what I found has startlingly lucrative implications for every savvy investor.
Indeed, my test results suggest some actions that will set us up for a profitable ride ahead...
Comparing These Returns Yields Some Startling Conclusions
What really caught my attention on September 22, 2014, when the Russell Death Cross occurred, was how much time analysts and pundits alike were spending making bearish predictions - but how little actual statistics were being used to support their claims.
After several hours, and few shots of espresso, a handful of dark chocolate-covered peanuts, and a 16,296 line Excel spreadsheet, I have definitive answers to some simple performance-related questions about the Death Cross and the Golden Cross.
For my research, I decided to study the S&P 500, because not only is it the most widely used benchmark, but it also allowed me to use Yahoo! Finance to track historical pricing all the way back to 1950.
And here's what I found...
Tracking the S&P 500 all the way back 1950, there have been 32 instances of a Death Cross and 32 occurrences of a Golden Cross.
With that as my starting point, I had a few questions...
The first thing I wanted to know was: How would an investor have performed if they were simply to establish a "short position" in the S&P 500 every time a Death Cross occurred and then flip the trade to a " long position" every time a Golden Cross occurred?
Using that simple strategy, an investor would have turned $10,000 into $455,544.33 for a 4,455.44% return over the last 64 years.
That sounds pretty good... Until you consider that the S&P 500 actually returned7,787.68% all on its own over the same time period.
It's pretty clear, trying to time the markets using a simple Death Cross/Golden Cross strategy isn't a winner over the long term.
Okay, that's one question answered.
The next thing I wanted to know was: What is the difference in performance between the "long periods" and "short periods"?
A "long period" is defined as any period when the 50-day SMA was above the 200-day SMA, which would follow a Golden Cross.
And a "short period" is defined as any period when the 50-day SMA was below the 200-day SMA, which would follow the dreaded Death Cross.
The results are going to surprise you.
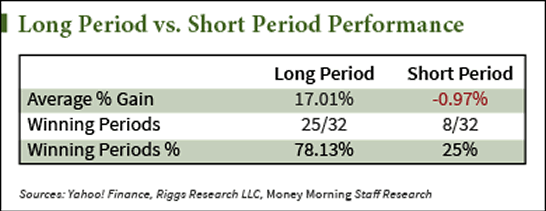
As you can see from Table 1 at left, the "long periods" totally outperformed the "short periods."

The long periods experienced an average return of 17.01%, with 25 out of 32 periods being profitable, resulting in an impressive 78.13% win rate.
On the other hand, the average return during the short periods was actually a -0.97% loss, with just 8 out of 32 periods being profitable, which resulted in an unimpressive 25% win rate.
Clearly, the periods following a Golden Cross demonstrated a positive statistical significance while the periods following a Death Cross not only demonstrated no statistical significance - but they also delivered average negative returns.
That answered my second question.
Score after the first head-to-head round... Golden Cross: 1, Death Cross: 0.
I had two more questions...
Assuming that you initiated a long position in the S&P 500 every time a Golden Cross occurred: How much would you go up/down after 30-trading and 50-trading days?
Assuming that you initiated a short position in the S&P 500 every time a Death Cross occurred: How much would you go up/down after 30-trading days and 50-trading days?
Once again, surprising results...

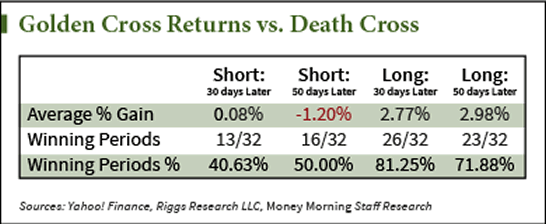
As you can see from Table 2 at right, the returns following a Golden Cross significantly outperformed returns following a Death Cross.
The average return 30 trading days after a Golden Cross was 2.77%, with 26 out of 32 examples being profitable - an 81.25% win rate.
The average return 50 trading days after a Golden Cross was 2.98%, with 23 out of 32 examples being profitable - a 71.88% win rate.
On the other hand...
The average return 30 days after a Death Cross was only 0.08%, and just 13 out of 32 examples were profitable, which resulted in a 40.63% win rate.
The average return 50 days after a Death Cross was actually a -1.20% loss, with 16 out of 32 examples being profitable, which resulted in a 50% win rate
Just with the first test, the periods following a Golden Cross demonstrated a positive statistical significance while the periods following a Death Cross demonstrated no statistical significance and negligible performance.
And that was my third question answered.
Score after two rounds... Golden Cross: 2, Death Cross: 0
Note: The previous returns are based on closing prices and do not take into account slippage.
Here's How We Cash In (Big) on All This Data
Don't get me wrong. I'm not saying the Death Cross has no merit. It did a great job of signaling the NASDAQ crash and more recently, the stock market crash, following financial crisis.
The fact of the matter is, I don't really have a dog in the fight. I just wanted to know, once and for all, what the answers to my simple questions were.
And that brings us to the obvious question: How do I trade on this information?"
While every investor's individual situation and risk tolerance differs, here's how I would play it:
After a Golden Cross... I would consider establishing positons that are more speculative in nature - but don't throw caution to the wind. Make sure you are buying within the parameters of a risk-parity portfolio structure such as the 50-40-10 model developed by Keith Fitz-Gerald, Chief Investment Strategist at Money Morning. And always use a pre-defined protective stop. Personally, I like to use a 25% trailing stop because it keeps my downside protected while leaving me plenty of room to the upside.
After a Death Cross... I would continue to establish positions - but I would shift my choices to more defensives choices. Additionally, I would consider using a tighter protective stop such as a 15% trailing stop. If the market does want to roll over, the tighter stop will results in smaller losses, leaving you plenty of capital to reallocate into new positions. On the other hand, if the Death Cross is just a head-fake, a 15% trailing stop will likely still afford you enough wiggle-room for your new (defensive) stock positions to absorb short-term volatility before powering ahead to new highs.
Before I sign off, I want to make one point perfectly clear: The results in the tests above pertain to the S&P 500 exclusively.
If I ran the same tests on the Nasdaq, gold, oil, or even the Russell 2000 Index (as mentioned at the top of the article) my results would vary - in some cases perhaps dramatically.
Therefore, don't make the mistake of making gold-related trading decisions (for instance) based on S&P 500 Golden Cross/Death Cross statistics.
Regarding the recent Russell's recent Death Cross - it's too early to tell.

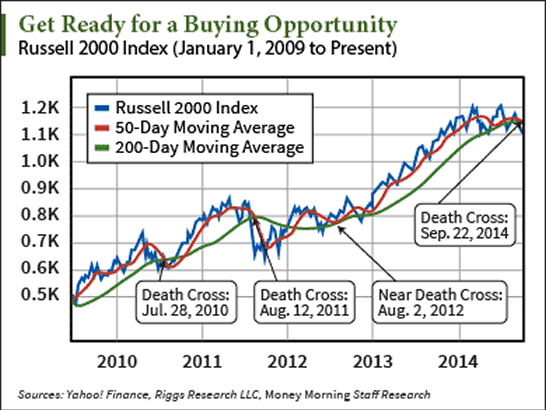
But one thing I do know is that the last two instances of a Russell 2000 Death Cross (as well as an additional near-Death Cross), as shown in the graph at left, have all ended up being nothing more than temporary noise... and have proved to be great buying opportunities.
Keep your pencils sharpened and your buy lists ready. If the current Death Cross is anything like recent and/or historical examples, we could be setting up for a great buying opportunity in the weeks and months ahead.
Stay tuned...
Money Morning/The Money Map Report
©2014 Monument Street Publishing. All Rights Reserved. Protected by copyright laws of the United States and international treaties. Any reproduction, copying, or redistribution (electronic or otherwise, including on the world wide web), of content from this website, in whole or in part, is strictly prohibited without the express written permission of Monument Street Publishing. 105 West Monument Street, Baltimore MD 21201, Email: customerservice@moneymorning.com
Disclaimer: Nothing published by Money Morning should be considered personalized investment advice. Although our employees may answer your general customer service questions, they are not licensed under securities laws to address your particular investment situation. No communication by our employees to you should be deemed as personalized investent advice. We expressly forbid our writers from having a financial interest in any security recommended to our readers. All of our employees and agents must wait 24 hours after on-line publication, or after the mailing of printed-only publication prior to following an initial recommendation. Any investments recommended by Money Morning should be made only after consulting with your investment advisor and only after reviewing the prospectus or financial statements of the company.
Money Morning Archive |
© 2005-2022 http://www.MarketOracle.co.uk - The Market Oracle is a FREE Daily Financial Markets Analysis & Forecasting online publication.


