Stock Market Trend Deceleration Tends To Precede Corrections
Stock-Markets / Stock Markets 2014 Nov 17, 2014 - 02:58 PM GMTBy: Andre_Gratian
 Current Position of the Market
SPX: Long-term trend - Bull Market
Intermediate trend - Intermediate structure unclear
Analysis of the short-term trend is done on a daily basis with the help of hourly charts. It is an important adjunct to the analysis of daily and weekly charts which discusses the course of longer market trends.
DECELERATION TENDS TO PRECEDE CORRECTIONS
Market Overview
Last week, the momentum of the rally from 1821 decreased again substantially, to the point of producing a flat pattern for the week with little change in price. In the last newsletter, I projected that a short-term top was expected. The behavior of the last few days, including Thursday's little climactic spike to a new high which retraced immediately, increases the probability that a correction is right around the corner. This is borne out by a technical condition which continues to deteriorate. Let's see where it stands:
Momentum: The weekly MACD barely managed to produce a bullish cross, but not enough to make a definitive statement about a resumption of the weekly trend. Nor did the weekly SRSI display enough momentum to overcome its previous high. Both of these have implication for the current market structure. The daily MACD is continuing to rise but, at the same time, beginning to roll over, as evidence by its declining histogram. As for the hourly MACD, it is ready to give a sell signal by going negative at the least provocation.
Breadth: The McClellan Oscillator is now in a short-term downtrend and has retraced from a reading of over 80 to just about 15. It could go negative as early as Monday. This has slowed the rise of the Summation Index considerably, but it has not turned it completely.
Structure: The weekly momentum oscillators best reflect the dilemma posed by market structure. There is neither confirmation that we are still in a primary wave IV correction, or that we are either in a wave III extension or outright wave V. Another couple of weeks will be needed to clear this up.
Accumulation/distribution: With the rapid loss of momentum, a pattern of deceleration and distribution has formed on the SPX P&F chart.
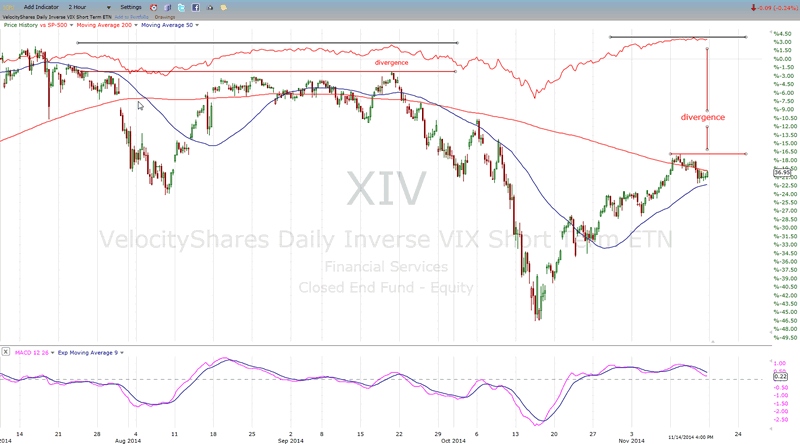
XIV: The XIV has gone from neutral to diverging negatively with SPX, bringing the latter one step closer to a correction!
Cycles: The long-term Kress cycles have either been virtually eliminated, or delayed by a few years. We will probably not know which for a long time.
Intermediate cycles continue to assert themselves and may cause an important market reversal.
Chart Analysis
Our first chart will again be that of the weekly SPX (chart courtesy of QCharts, including others below) with the McClellan Summation Index posted underneath it.
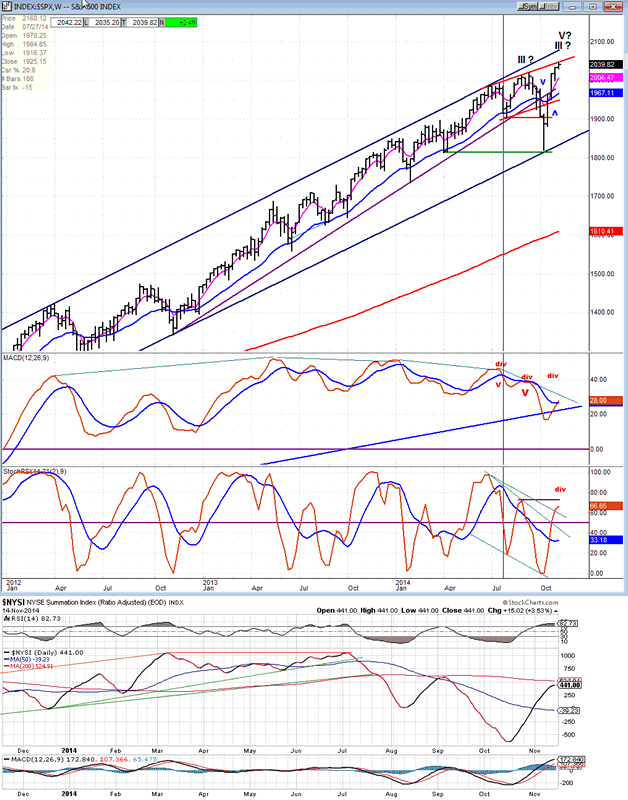
The weekly SPX chart made a new high last week. This has caused some continued diverse opinions within the EW ranks as to where we are now: in primary wave V or still in wave IV. Arguments can be made for both which I will not verbalize here, but say simply that this issue has yet to be resolved technically. All the weekly oscillators -- price and breadth momentum indicators alike -- agree with both sides as long as the SRSI does not overcome its former high. Should it do so, the balance would tip in favor of the more bullish clan. But they are probably wrong about one thing; their claim that the bull market could continue to over 2200 is very unlikely, unless the bull market continues for many more months in a slow grind. Even if we are to move still higher, the loss of momentum which started in the daily indicators will begin to show up in the weekly prices. Of course, if the long-term Kress cycles have now turned up, it will manifest itself in a continued uptrend. Why don't we let the market tell us what it wants to do?
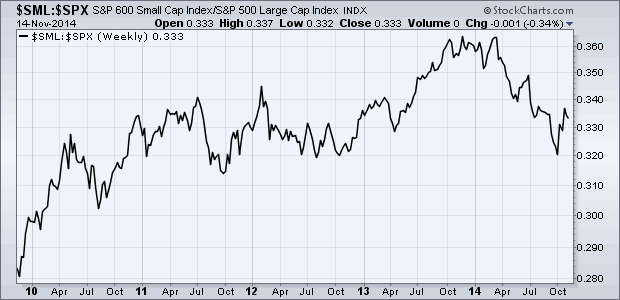
In fact it may already be clearly stating its intentions! If you look at the following weekly chart of the small cap index ratio to the SPX (courtesy of StockChart.com), it clearly foretold of the market weakness which started in mid-September. And where is the super-strong rally of the past five weeks? Is this really a bullish picture?
Note that this index topped in March, which is the same time frame in which the IWM made its high! We'll analyze that one a little later on.
The loss of upside momentum shows up clearly than in the daily SPX chart.
The price pattern is making a rounded top which appears to find its culminating point at the resistance provided by a lateral trend line which has now stopped further advance of prices for the past five months. That, in itself, should create some uncertainty in those that expect the SPX to continue its advance without a price adjustment, first.
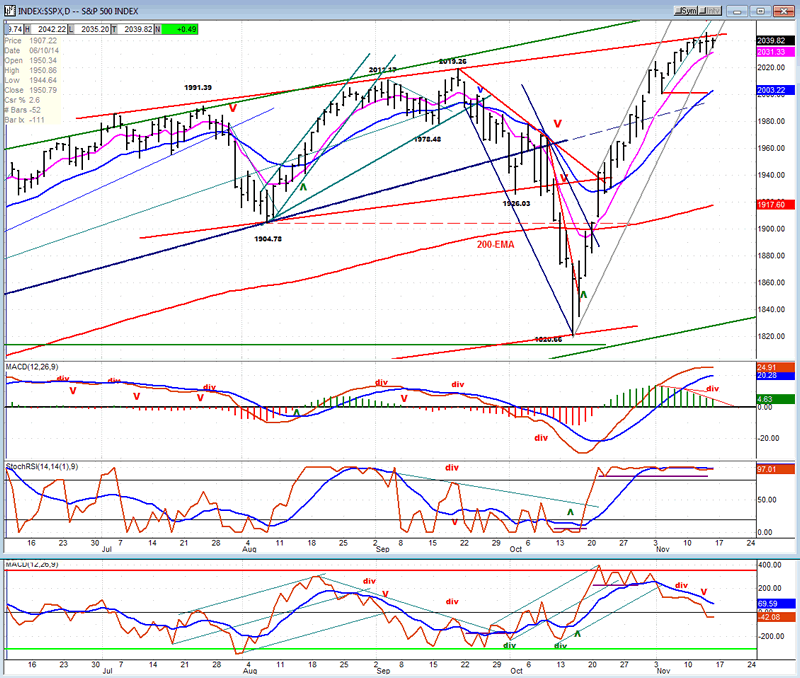
This deceleration in momentum is also visible in some of the oscillators which have steadily retracted over the past two weeks. While the SRSI has yet to do so, its type of pattern normally results in a sudden decline such as the one which took place in early September. This will probably happen when the index breaks decisively out of its channel at the same time that it closes below its 8-day EMA - which could be as early as Monday.
A little weakness in the A/D decline is all that will be needed to send prices south. If you notice, the lower indicator has already gone negative and when it does, it's normally the sign that a correction is beginning. The longer it remains negative, the longer the correction. What makes a severe correction doubtful at this time is the fact that the MACD is still very positive. It takes the combination of both oscillators going negative at the same time for a severe correction to start. We could have a condition similar to what happened in late August whereby the A/D oscillator went negative, but had to wait for the MACD to join it below the line for a protracted decline to start. In the meantime, prices engaged in a minor rally.
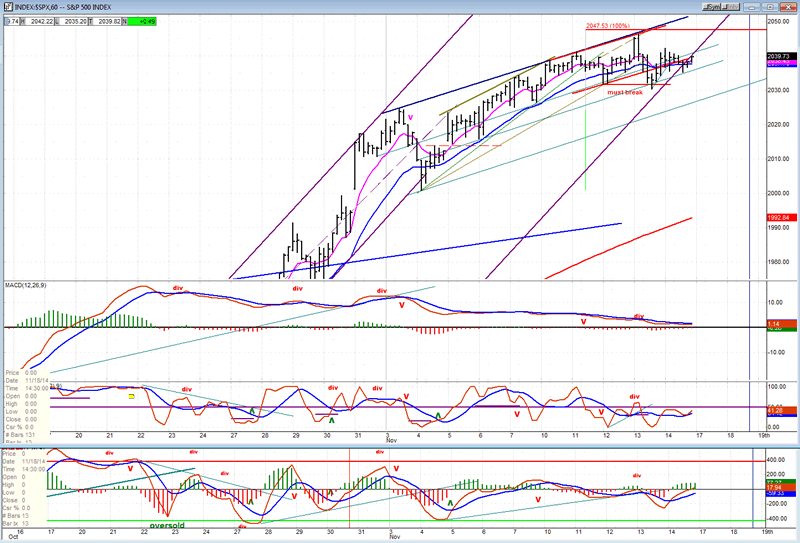
The hourly chart is (strangely enough) a small replica of the daily chart. It exhibits the same pattern of deceleration which is, of course, more drawn out, but with a little bonus. Frequently, intra-day charts will end an uptrend with a small, rapid climactic move which retraces immediately. This is what visibly happened on Thursday, with the index even briefly breaking below its previous low, but it was quickly picked-up since it also found support near the channel line. By the end of a lackluster day, the SPX was trading outside of its channel line, which makes it vulnerable to a weak opening on Monday.
The SRSI has remained negative for the past 4 days, and any decline of a couple of points from here will send the MACD and the A/D decline oscillators below the line as well. That should be the hourly signal which will trigger a daily one as well if there is no recovery by the end of the day.
Sentiment Indicators
The SentimenTrader (courtesy of same) has changed its reporting format to make it a little more explicit. It is now reporting the smaller scale of percentages so that last Friday, the value of the long-term indicator was 57 and not what would have been 60, before. It's a small refinement which may prove worthwhile.

XIV (Inverse NYSE Volatility Index) - Leads and confirms market reversals.
The inverse version of the VIX is far more revealing of the state of the market than the original one. While looking at a chart and its indicators are very helpful, it is important to look at other data which strongly supports what the chart shows. This is what happens when we look at this separate indicator. It has a propensity for exhibiting clear divergence at market tops as it did, first in July, and again in September. And it is doing it again today in an even more dramatic way! Although the scale of the SPX is not ideal, it's good enough to show the sharp differences of levels between it and the XIV. We can't jump to conclusions just yet that we are about to have a severe decline because there is not enough divergence built-up in the short-term XIV, but there is plenty over the longer term to create enough doubt about the life span of the current market uptrend.
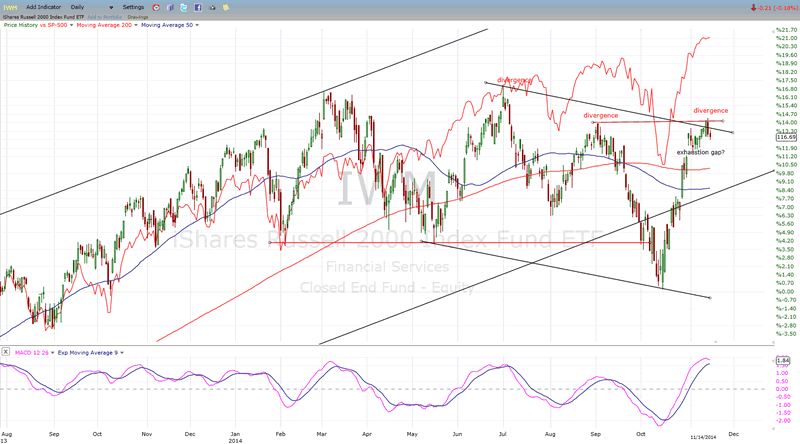
IWM (iShares Russell 200) - Historically a market leader.
This chart illustrates IWM vs. SPX. As you can see, IWM has been losing relative strength to SPX since July. Even with its current rally, IWM has actually increased its divergence to SPX. This would have to change dramatically to make a longer-term bullish case for the market.
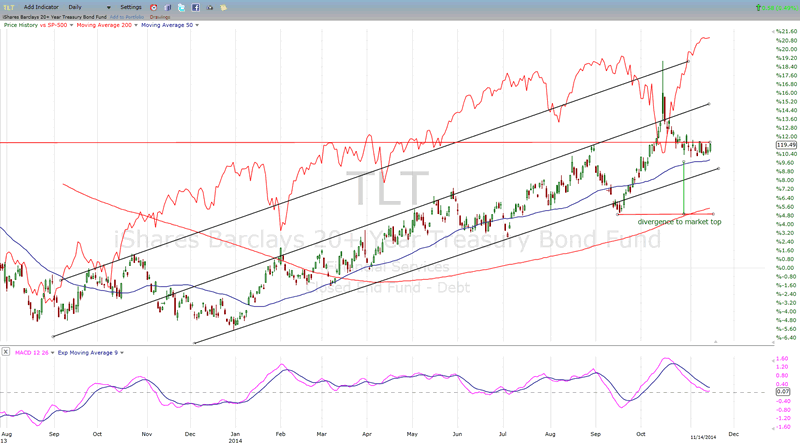
TLT (20+yr Treasury Bond Fund) - Normally runs contrary to the equities market.
TLT normally goes against equities, but it has been doing a good job of tracking the SPX this year, and lately has become even stronger. The same conclusions can be drawn as those drawn from the previous chart. Also, this strong SPX rally has not affected TLT in the least and it seems to simply be waiting for SPX to be done with its bullish folly!
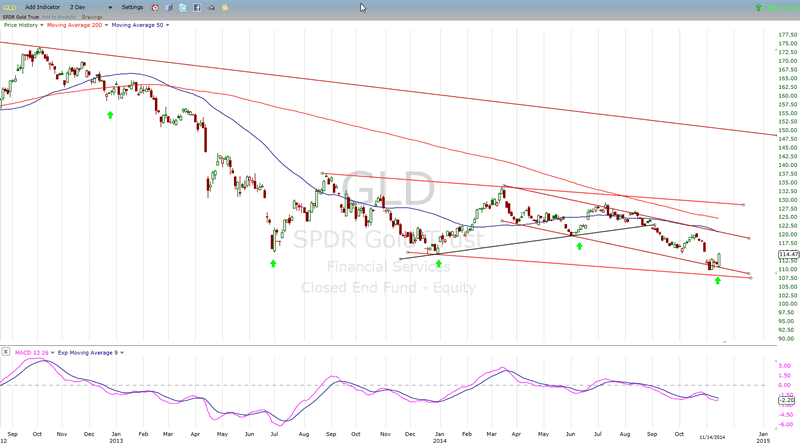
GLD (ETF for gold) - Runs contrary to the dollar index.
As suggested last week, it looks as if GLD has reached the low of its 25-wk cycle a little early and is turning up. Since it has not yet really given a buy signal, it may consolidate a little longer before doing so. The question is: "What will it lead to?" GLD would need more preparation to warn that it is about to embark on a strong move up. Let's give it a little time.
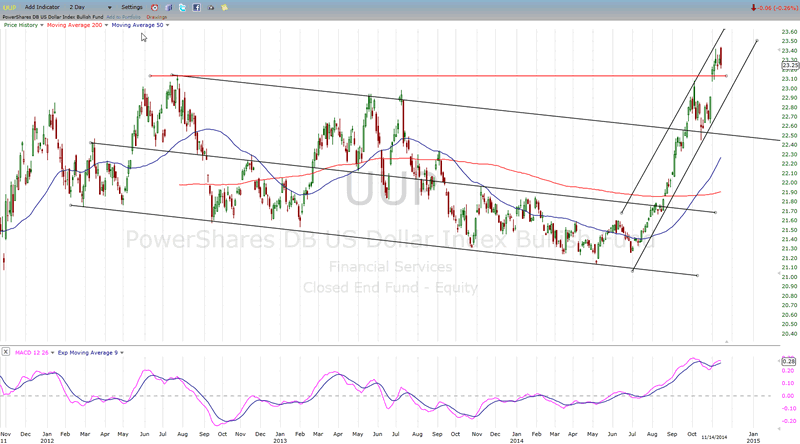
UUP (dollar ETF)
It is not quite clear if UUP is done with its 5th wave from the low which should preced a correction, or if there are slightly higher prices ahead. It, too, needs to be given a little more time.
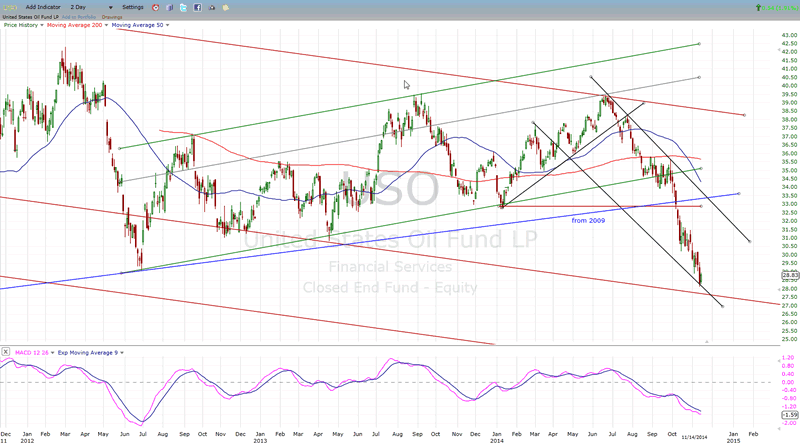
USO (US Oil Fund)
USO has reached the bottom of its declining channel, but the way that it reached it does not look conducive to an immediate reversal of its bearish trend. Although it may find some technical reason to consolidate, that would be about as bullish as it could get over the near-term.
Summary
It looks as if we have entered a period which will be increasingly challenging for those who are bullish. The longer term is beginning to reveal an intermediate phase of upward momentum deceleration and, although new highs could still be attained, they should consist of shorter and shorter bullish trends over the next few weeks before a more severe correction takes place.
It is possible that the bulls may not even be afforded this gradual phasing out luxury but that the up-trend will be even more limited. For it to continue to be positive, we would need to see some serious changes in the various technical divergences which have been taking place over the past few months. (Some of these are illustrated above.)
FREE TRIAL SUBSCRIPTON
If precision in market timing for all time framesis something that you find important, you should
Consider taking a trial subscription to my service. It is free, and you will have four weeks to evaluate its worth. It embodies many years of research with the eventual goal of understanding as perfectly as possible how the market functions. I believe that I have achieved this goal.
For a FREE 4-week trial, Send an email to: ajg@cybertrails.com
For further subscription options, payment plans, and for important general information, I encourage
you to visit my website at www.marketurningpoints.com. It contains summaries of my background, my
investment and trading strategies, and my unique method of intra-day communication with
subscribers. I have also started an archive of former newsletters so that you can not only evaluate past performance, but also be aware of the increasing accuracy of forecasts.
Disclaimer - The above comments about the financial markets are based purely on what I consider to be sound technical analysis principles uncompromised by fundamental considerations. They represent my own opinion and are not meant to be construed as trading or investment advice, but are offered as an analytical point of view which might be of interest to those who follow stock market cycles and technical analysis.
Andre Gratian Archive |
© 2005-2022 http://www.MarketOracle.co.uk - The Market Oracle is a FREE Daily Financial Markets Analysis & Forecasting online publication.


