Forget About Crude Oil Price Testing 2009 Low
Commodities / Crude Oil Nov 19, 2014 - 10:43 AM GMTBy: Austin_Galt
 Oil has hit a slick recently with price sliding over 30% in the last five months. There are now calls for price to potentially test the 2009 lows. While I think this is a bit extreme, let’s investigate the charts to see what the evidence there suggests.
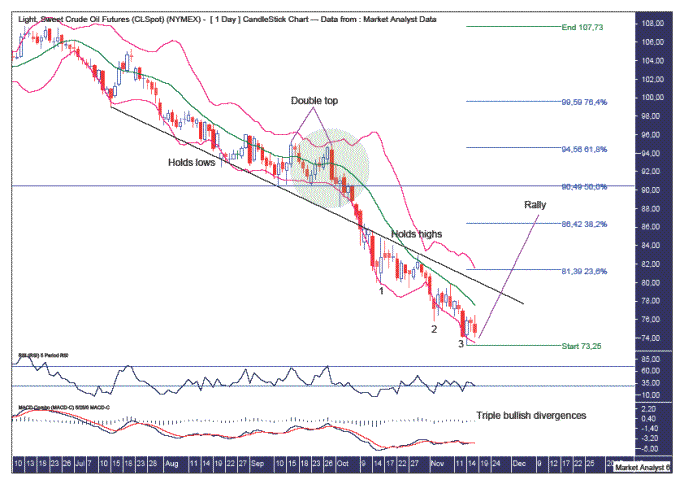
OIL DAILY CHART

We can see price declining from the June 2014 high at US$107.73. This was your stock standard, run-of-the-mill downtrend. Steady as she goes. Then towards the end of September, price ramped up the velocity of the downtrend and price started to fall at a much faster rate. This can be seen in the green highlighted circle.
I have drawn a horizontal line which denotes the swing low in September. We can see in the green highlighted circle that price initially found support at this level before trading back up and making a double top. This was a bearish double top as it was with the trend.
This double top has led to a steep decline that took out the previous swing low and the downtrend then began to accelerate. This is demonstrated by the black downtrend line I have drawn. This trend line initially held the lows of the downtrend. Then when price accelerated to the south side this same trend line held the highs of the downtrend.
Now what is important about this development is that when this happens it usually means the end of the current downtrend is nearing. So what other evidence is there of the downtrend ending?
A common bottoming pattern is three consecutive lower lows. I like to call this the “three strikes and you’re out” low formation and this looks to already be in place now.
Price hit a low of US$73.25 on the 14th November and I suspect that is the end of this current downtrend. Keep in mind, after any rally the overall trend may continue further south.
This third and potentially final low looks to be accompanied a triple bullish divergence in both the Relative Strength Indicator (RSI) and the Moving Average Convergence Divergence (MACD) indicator. This generally leads to a significant rally.
So assuming we get a rally from here, how high could we expect price to rally?
I have added Fibonacci retracement levels of the move down from June 2014 high to the recent low. In these instances, price often rallies back to where the downside acceleration began. The September swing low is around the 50% level at US$90.49 while the double top is around the 61.8% level at US$94.56. I favour price rallying back to one of these levels with a preference for the latter.
Let’s now look at the bigger picture using the monthly and yearly charts as shown in the recent November newsletter.
OIL MONTHLY CHART

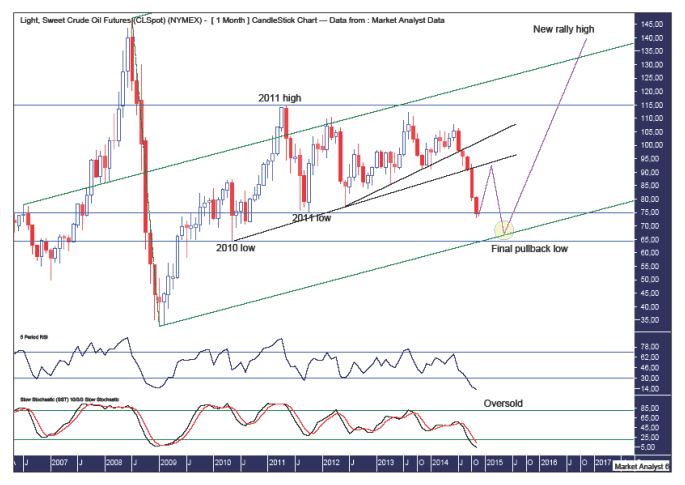
We can see price has traded in a tight range for the last few years. The high of the range was set in 2011 at US$114.83 while the low of the range was set the same year at US$74.95. This recent move down is the first time price has traded outside of this range.
I have drawn two black uptrending lines from the 2010 low and the 2011 low. Price recently broke down through these trend lines which saw the downtrend accelerate.
While price has marginally broken the 2011 low, I suspect price may find support here and essentially form a double bottom with the 2011 low. This would get the traders in that play the reaction higher. Perhaps they can push price back up to the first black trend line which would be somewhere between the 50% and 61.8% Fibonacci levels as shown in the daily analysis.
However, considering the double bottom is against the trend, price should then turn back down and bust through this support level.
So where could we expect price to finally make a solid low?
I have drawn an Andrew’s Pitchfork which shows price has mostly been trading in the lower channel albeit closer to the middle band. I suspect price is now headed down to test the lower band of this pitchfork. And it is here where I expect the final pullback low to form. Price testing this lower pitchfork trend line in the second quarter of 2015 looks to be slightly under the US$70 mark.
Also, the 2010 low at US$64.24 should be solid support and I doubt price will trade below this level. Price breaking below this level would likely nullify this analysis.
So, I am looking for the final pullback low to be around the US$67-US$68 level. This can be seen in the yellow highlighted circle.
The lower indicators, the RSI and Stochastic indicator, are both showing very oversold readings so a rally now would help to relieve some of this negativity. Then perhaps the next move to final lows will be accompanied by bullish divergences in these indicators. Let’s see.
And once the final pullback low is in place, perhaps we could expect a move up to new rally highs and into the higher pitchfork channel.
OIL YEARLY CHART

This is from the November newsletter and nothing has changed .
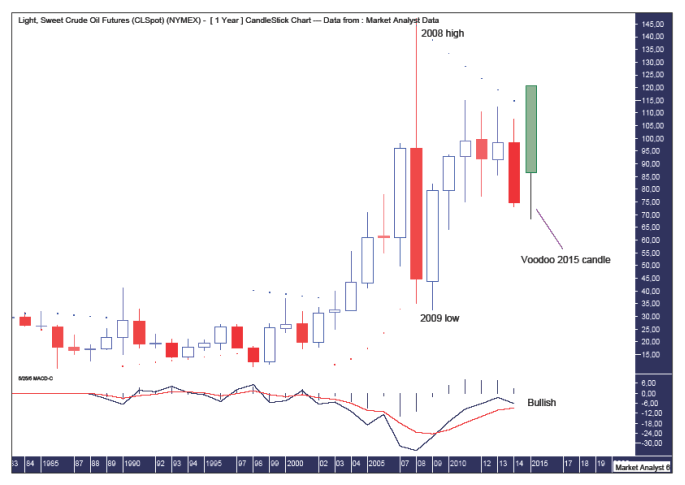
We can see the two candles of the years 2008 and 2009 provided a massive trading range. The high in 2008 was US$147.27 while the low in 2009 was US$32.70. A lot of money was won and lost in those two years!
The Parabolic Stop and Reverse (PSAR) indicator has a bearish bias and has provided solid resistance to price in recent years. If price were truly in a big bear trend then this resistance could be expected to hold. But to my eye, the chart does not look like a bear market. At worst, it looks like a big consolidating market. At best, a massive bull market with the 2009 low being a higher low.
With that in mind, it is normal for price to initially be rejected by the PSAR resistance. But then the charade ceases and price reverses back up to bust the dots.
I have drawn voodoo style the candle for 2015 as I expect to see it. It shows the wick making new yearly lows and testing the 2010 low before reversing higher and finishing the year well and truly in positive territory. And busting the PSAR dots in the process. Let’s see.
The Moving Average Convergence Divergence (MACD) still has a bullish bias with the blue line above the red line and even though the averages appear to be moving closer together there is still plenty of time for price to take advantage of this bullishness.
And as for oil testing its 2009 lows, as far as I’m concerned, the Soprano’s Paulie Gualtieri says it best – “Forget about it”.
By Austin Galt
Austin Galt is The Voodoo Analyst. I have studied charts for over 20 years and am currently a private trader. Several years ago I worked as a licensed advisor with a well known Australian stock broker. While there was an abundance of fundamental analysts, there seemed to be a dearth of technical analysts. My aim here is to provide my view of technical analysis that is both intriguing and misunderstood by many. I like to refer to it as the black magic of stock market analysis.
© 2014 Copyright The Voodoo Analyst - All Rights Reserved
Disclaimer: The above is a matter of opinion provided for general information purposes only and is not intended as investment advice. Information and analysis above are derived from sources and utilising methods believed to be reliable, but we cannot accept responsibility for any losses you may incur as a result of this analysis. Individuals should consult with their personal financial advisors.
© 2005-2022 http://www.MarketOracle.co.uk - The Market Oracle is a FREE Daily Financial Markets Analysis & Forecasting online publication.


