


Stock Investors Look Ahead into 2015
Stock-Markets / Financial Markets 2015 Dec 21, 2014 - 03:33 PM GMTBy: Clif_Droke

 With 2014 winding down, now would be a convenient time to discuss the prospects for the financial market and economy in 2015.
Year 2014 was in some respects a tumultuous year; from the slowdown in Europe and China to the collapse in oil and ag commodity prices, the deflationary undercurrents of the 60-year cycle was apparent this year. The long-awaited bottom of the 120-year cycle of deflation was finally made in October, and aside from some residual weakness still evident, the cycle bottom was a successful one.
With the lifting of the deflationary cycle, year 2015 promises to be a much stronger one than last year. The birth of a new long-term cycle will mean slow, steady re-introduction of inflation into the economy. More to the point, the next few years should witness gradual re-inflation. The runaway inflation that some analysts are wary of is still many years away. By the same token, the recent fears of many economists of a deflationary collapse are misguided. Deflation will gradually cease to be a persistent problem in 2015 and beyond as commodity prices should stabilize next year and consumer finances should continue to see improvement.
Year 2015 is also of course a "Five Year" which is the most reliably bullish year of any given decade. Going back to the previous 120-year cycle bottom of 1894, there has never been a bear market in the Five Year. One reason for this is because the 10-year cycle - a component of the 120-year long-term cycle - always bottoms at the end of the Four Year. The 10-year cycle is the primary long-term directional cycle within any given decade. Thus with a fresh new 10-year cycle underway in 2015 the odds favor a good year ahead for equities.
Fortunately for stock investors, most major indices are in a good position heading into 2015. The major indices are above their key longer-term trend lines, namely the 30-week and 60-week moving averages. Stocks have built up a good head of steam and are therefore primed to enjoy an overall bullish year ahead thanks to the release of upward pressure from the newly formed long-term Kress cycles.
One of the factors which kept many retail traders from participating in the stock market in 2014 was the lack of a clear directional bias in small cap stocks. The 1-year graph of the Russell 2000 Small Cap Index (RUT) below perfectly illustrates the frustration that small investors experienced this year.
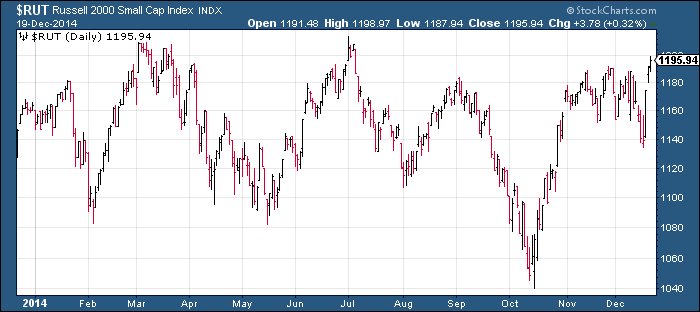
A truism of investor psychology is that prolonged sideways movement in equity prices does more to discourage small investors than anything else. Indeed, a lateral trading range does more to discourage investors from investing than a major market collapse has ever done.
Will the small investor return to the stock market in 2015? This is very much an open-ended question and one that defies an easy answer. It can be stated with some degree of confidence, however, that the lateral trading range in the small cap stocks will likely be resolves in 2015. This will do much to attract some sideline money in the year ahead, though whether the anticipated breakout in the small caps is enough to shake the average retail investor from his reticence is debatable.
My guess is that small investors will remain out of action in 2015. Many are still stinging from the 2008 market collapse and are too gun shy to invest in equities. Others view the heights achieved by stocks in the last few years as untenably high and therefore vulnerable to a major decline. Their collective reluctance to return to the stock market will, however, limit their options for growing their capital in the year ahead. Instead, many will elect to remain in low-yielding bonds and other underperforming assets.
Another big concern for investors heading into 2015 is the state of the U.S. economy. Much has been made over the improvement in consumer confidence this year, yet consumer spending hasn't been as powerful as the confidence levels would suggest. A better reflection of what the average consumer is doing with his money is visible in the New Economy Index (NEI). NEI is a basket average of several stocks within the consumer retail and business sectors. For years it has provided an accurate real-time picture of the overall state of the U.S. retail economy. Here's what the NEI looks like right now.
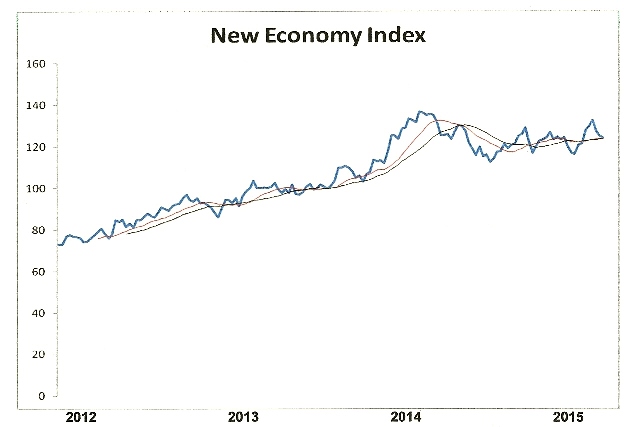
NEI reached an all-time high last January and has spent the bulk of 2014 consolidating in a lateral range. The NEI chart looks good but not great, and there's definitely room for improvement. My interpretation of the NEI pattern is that consumers are still spending at above-average levels but haven't completely "let loose" with those ever-increasing spending binges that characterize strong economies.
Although joblessness isn't a major problem like it was in years past, consumers are apparently concerned enough about keeping their jobs that they haven't accelerated their spending. That may change as we head further into 2015, especially if the financial market outlook shows continued improvement.
Mastering Moving Averages
The moving average is one of the most versatile of all trading tools and should be a part of every investor's arsenal. The moving average is one of the most versatile of all trading tools and should be a part of every investor's arsenal. Far more than a simple trend line, it's a dynamic momentum indicator as well as a means of identifying support and resistance across variable time frames. It can also be used in place of an overbought/oversold oscillator when used in relationship to the price of the stock or ETF you're trading in.
In my latest book, "Mastering Moving Averages," I remove the mystique behind stock and ETF trading and reveal a completely simple and reliable system that allows retail traders to profit from both up and down moves in the market. The trading techniques discussed in the book have been carefully calibrated to match today's fast-moving and sometimes volatile market environment. If you're interested in moving average trading techniques, you'll want to read this book.
Order today and receive an autographed copy along with a copy of the book, "The Best Strategies For Momentum Traders." Your order also includes a FREE 1-month trial subscription to the Momentum Strategies Report newsletter: http://www.clifdroke.com/books/masteringma.html
By Clif Droke
www.clifdroke.com
Clif Droke is the editor of the daily Gold & Silver Stock Report. Published daily since 2002, the report provides forecasts and analysis of the leading gold, silver, uranium and energy stocks from a short-term technical standpoint. He is also the author of numerous books, including 'How to Read Chart Patterns for Greater Profits.' For more information visit www.clifdroke.com
Clif Droke Archive |
© 2005-2022 http://www.MarketOracle.co.uk - The Market Oracle is a FREE Daily Financial Markets Analysis & Forecasting online publication.