


Stock Market Crash and High Yield Debt
Stock-Markets / Financial Crash Dec 23, 2014 - 07:08 AM GMTBy: Harry_Dent

 Since late 2008, the unprecedented quantitative easing (QE) that flooded our economy has produced another terrible consequence — the unbelievable mispricing of high-risk, high-yield bonds.
At the top of the previous boom in early 2008 high yield bonds grew to $710 billion and were yielding 10% after dropping to as low as 7.5% in early 2007.
That’s a more appropriate yield for investors taking such risks in what back then still looked like a good economy.
Those yields skyrocketed to 23.5% in late 2008 as the global financial crisis emerged seemingly out of nowhere with the eruption of the subprime mortgage crisis. As soon as the riskier sectors begin to go bad, the bond markets start to worry about the rest of the sectors.
Investors lost nearly 50% on a basket of high-yield bonds in 2008 and their loss was almost as much as the stock crash.
Next time it’s going to be worse….
With massive QE from 2009 through 2014, junk bond yields mushroomed to $1.6 trillion and went to unprecedented low levels of 5% yields between early 2013 and early 2014. That was just 3% points higher than risk-free 10-year Treasury bonds.
This means that companies are going to borrow money to buy back their own stocks and now risky ventures seem much more feasible, things like fracking.
Earlier this month, I covered the fracking bubble and its similarity to the subprime bubble. The subprime bubble was larger in magnitude but rapidly plunging oil prices could be a more explosive trigger that sets off the next debt crisis.
Before we get to that, the chart below shows the peak in junk bond prices (and the bottom in yields) in early May of 2010, exactly when we gave a clear long-term sell signal in the May 10 newsletter. The HYG ETF peaked there at just above $96.
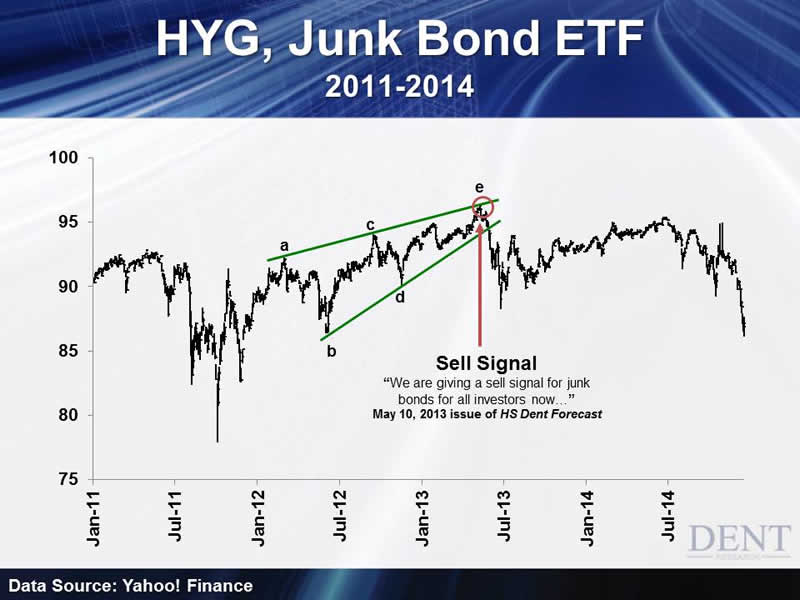
I had been monitoring a rising bearish wedge starting back in 2011 and we couldn’t have called that top better.
After falling to $88, that index rebounded to $95 and has now fallen to $86 on December 16, or 10% from the all-time high. Energy junk bonds have fallen 20%, and there’s much more to come.
If yields skyrocketed from 10% to 23.5% in 2008, they’re likely to blast from 5% to 25%… even up to 30% come 2015 or possibly 2016 in a deeper downturn and bigger overall bubble burst.
That means high-yield bond holders are likely to see 60% plus losses next time around.
By various estimates, the energy sector, largely frackers, accounts for 15.4% to as high as 20% of the total junk bond market. In 2014, 61% of the junk bonds were in the energy sector. That’s the sound of a bubble peaking!
Yes, the subprime mortgage market was larger, but frackers have also borrowed through leveraged loans to the tune of $300 billion and they are even worse. There is a total of $500 billion+ in risky energy debt in this sector, that is still enough to trigger a debt crisis.
What is the real trigger? Obviously rapidly falling oil prices.
Recall that the greatest bubble burst I have seen in modern history was the oil crash from $147 to $32 in just over four months in mid- to late 2008. Oil is highly volatile and traded with high leverage.
Oil traded in a range of $75 to $115 for years and then broke out of that sharply, just like gold did in early 2013 (we had a strong sell signal in gold and silver in late April of 2011 right at the top for silver at $49).
The first sharp drop was from $106 to $54 — $52 or near 50% in just 6 months with most of that in a matter of weeks!
Frackers have created an additional three million plus barrels per day in the recent fracking bubble and it’s been fueled by such cheap debt as it’s capital intensive to find new oil sources. Cheap money would make it far more attractive and create a bubble…
Surprise, surprise!
But here’s the dynamics. Most frackers break even between $55 and $85.
So there will be little or no new drilling or junk bond issuance after this recent drop. But the variable costs of “lifting” the oil out are only $10 to $20.
This means that present rigs will keep producing and the production bubble that took off in 2011 will continue into at least late 2015 before such wells start to max out as they only last two years on average.
This means supply will continue to expand for about a year while global growth continues to decelerate, and it’ll probably expand by even more than we forecasted through our demographic projection. This means oil will fall further in 2015, with another crash likely to bottom by September.
After breaking the key $75 to $80 levels in early November, the only support is at the late 2008 lows of $32. I expect oil to rally a bit into early 2015 back towards $72 to $80 and then to crash again.
This next crash is likely to start by late March, if not earlier.
Many fracking companies will find it very challenging to meet their debt service and will be defaulting — but they will continue their production in order to maintain short-term cash flow.
Once yields spike for high-yield energy bonds, they’ll also start spiking for other sectors.
The student loan bubble will start to crack, as will the subprime auto lending bubble. Then there is $5.7 trillion in U.S. dollar debt to corporations in emerging countries.
That will blow as commodity and oil prices continue to fall and the dollar rises, making those loans more expensive to pay off. The growing slowdown in fracking will also hurt jobs down the road because, as we all know, this booming sector had huge growth in job creation.
The demographic trends show surprisingly slow growth next year in Europe and China and it’ll definitely add insult to injury for those countries.
The Fed can’t do a thing about the falling oil prices. They were the key factor in creating the oil and fracking bubble with their “free” money policies. If oil keeps falling, more frackers (and some foreign countries from Venezuela to Russia to Iran) will go bust.
Just when clueless economists and central bankers think they’ve hit escape velocity, the fall in oil prices may just be the trigger that sets off the next debt crisis and will only continue to spread as global growth evaporates.
The markets see no risk and continue to rally like they are on “crack” — which they are.
I see this stock rally, at the very latest, lasting into mid-March of next year and I see the Dow hitting as high as 19,000.
The key sign of the final peak would be a rebound in oil and a final “risk-on” rally in commodities, gold and stocks.
If oil gets back into the $70s that would be the time to start selling stocks and all risk-on financial assets.
Harry
Follow me on Twitter @HarryDentjr
Harry studied economics in college in the ’70s, but found it vague and inconclusive. He became so disillusioned by the state of the profession that he turned his back on it. Instead, he threw himself into the burgeoning New Science of Finance, which married economic research and market research and encompassed identifying and studying demographic trends, business cycles, consumers’ purchasing power and many, many other trends that empowered him to forecast economic and market changes.
Copyright © 2014 Harry Dent- All Rights Reserved Disclaimer: The above is a matter of opinion provided for general information purposes only and is not intended as investment advice. Information and analysis above are derived from sources and utilising methods believed to be reliable, but we cannot accept responsibility for any losses you may incur as a result of this analysis. Individuals should consult with their personal financial advisors.
© 2005-2022 http://www.MarketOracle.co.uk - The Market Oracle is a FREE Daily Financial Markets Analysis & Forecasting online publication.