Climate Change - What If The World Can’t Cut Its Carbon Emissions?
Politics / Climate Change Dec 29, 2014 - 03:17 PM GMTBy: Raul_I_Meijer
 Roger Andrews: Many people, including more than a few prominent politicians, accept that global warming must be limited to no more than two degrees C above the pre-industrial mean, or a little more than one degree C above where we are now, to avoid dangerous interference with the Earth’s climate. Let’s assume these people are right, that the 2C threshold really does represent the climatic equivalent of a cliff and that bad things will happen if we drive off it.
So how do we apply the brakes?
According to the IPCC by limiting cumulative future global carbon emissions to no more than 500 gigatons, and even then we would have only a two-thirds chance of success:
To have a better than two-thirds chance of limiting warming to less than 2°C from pre-industrial levels the total cumulative carbon dioxide emission from all human sources since the start of the industrial era would need to be limited to about 1,000 gigatonnes of carbon. About half of this amount had already been emitted by 2011.
Here we will ignore the one-third chance of failure and use 500 gigatons as the “safe” emissions limit. Can we stay below it? Figure 1 summarizes the current position. The black line (data from EDGAR) shows progress, or lack thereof, in cutting global emissions since the United Nations Framework Convention on Climate Change (UNFCCC) started the ball rolling in 1992. The red line is a projection of the black line. The blue line, which intersects zero in 2117, amounts to 500 Gt of future carbon emissions. I assumed a linear decrease for simplicity but other pathways are of course possible:
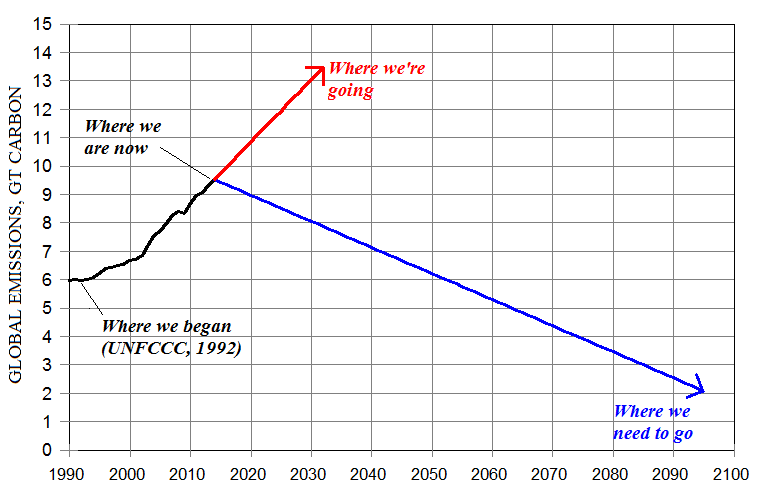
Figure 1: Current position on cutting global emissions to “safe” levels
Obviously the world is going to have to reverse course in a hurry if it is to have any chance of keeping warming below the 2C danger threshold. What are the chances that it can? Let’s look at which countries the emissions are coming from and see what the prospects are.
The world’s emitters are commonly divided into two categories – the “developed” countries, such as the US, UK, Germany and Japan, and the “developing” countries, such as Egypt, India, Malawi and Paraguay. We will look first at the developed countries, which presently emit a third of the world’s carbon. Developed country emissions for 1970 through 2012 are summarized in Figure 2:
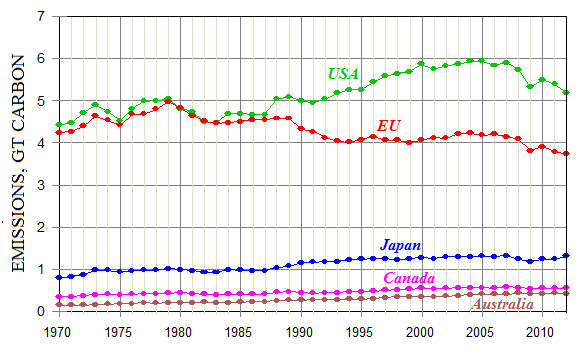
Figure 2: Developed country emissions from fossil fuel burning, 1970-2012
The United States accounts for 16% of global emissions (the percentages given here are from 2012 EDGAR data). US emissions have been trending down since 2005 partly because of the shale gas boom and partly because of the 2008 recession. The Obama administration recently adopted rules designed to cut US emissions further but whether they will survive is uncertain, and even if they do the chances that Congress as presently constituted will agree to emissions cuts unless the developing countries follow suit are effectively zero. The 1997 US Senate rejected US participation in the Kyoto Protocol for this reason, and given the opportunity the present Senate would do the same.
The European Unionaccounts for 11% of global emissions. For some years the EU has been setting an example to the world by unilaterally pursuing ambitious emissions targets, although so far with little to show for it (the downtrend in EU emissions since 2006 is largely a result of the 2008 recession and the EU’s slow recovery). The realization that the EU can’t save the planet all by itself is, however, finally beginning to sink in, and as a result the EU has hardened its negotiating position, stating at the Lima climate talks that mandatory emissions targets must now be set for all countries, not just the developed ones.
Australia, Canada and Japan collectively emit 7% of the world’s carbon. All three are presently somewhat less than enthusiastic about emissions cuts and are unlikely to become greatly more enthusiastic in the foreseeable future. They won’t move unless everyone else does.
Now on to the developing countries, which emit two-thirds of the world’s carbon and are responsible for all of the growth in global emissions since the world embarked on its quest to cut them in 1992. Developing country emissions are summarized in Figure 3:
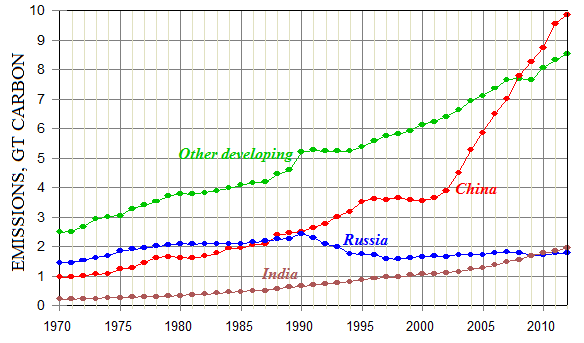
Figure 3: Developing country emissions from fossil fuel burning, 1970-2012
China, which now accounts for 29% of global emissions (according to EDGAR; other sources put the figure at 25-26%) is the key player. The UNFCCC exempts China and the other developing countries from emissions caps – in fact it encourages them to build more power plants in order to eradicate poverty – and China wants to keep it that way. China pays lip service to the need to combat climate change but considers economic development far more important, as illustrated in Figure 4. The total disregard for the “Spirit of Kyoto” is almost comical:
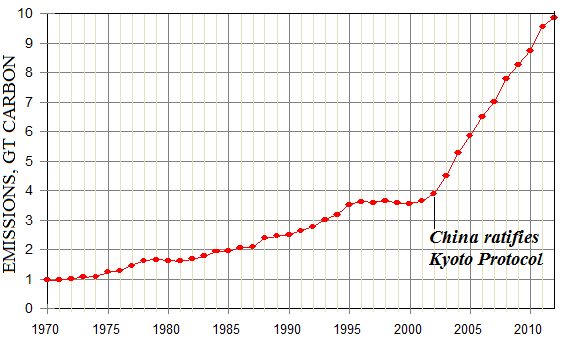
Figure 4: China’s emissions before and after ratifying the Kyoto Protocol
(The lip service consists of a) China’s 2005 commitment to reduce its carbon intensity – the amount of carbon emitted per unit of GDP – by 40-45% by 2020 and b) its recent commitment to make its best efforts to peak its emissions by 2030. Figure 4 shows what happened to China’s emissions after its 2005 commitment. Its latest commitment pretty much guarantees that its emissions will continue to rise for at least the next 15 years.)
India, with 6% of global emissions, makes no bones about where it stands: “The world must accept that India’s per capita carbon emissions will need to rise rapidly if it is to eliminate poverty, the environment minister said on Friday, as delegates meet in Lima for key UN climate change talks.” Economic development takes priority over the need to combat climate change in India too, as illustrated in Figure 5:
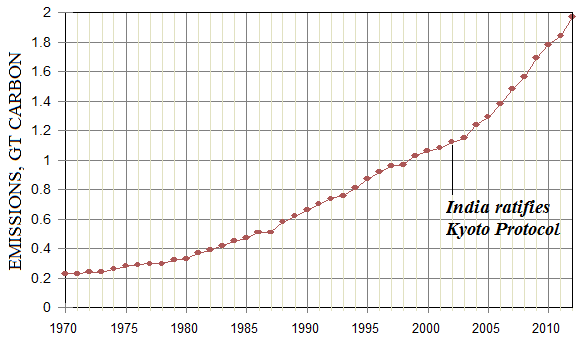
Figure 5: India’s emissions before and after ratifying the Kyoto Protocol
The position of Russia, which accounts for 5% of global emissions, is predictable. Under Kyoto Russia committed to keep its emissions below 1990 levels and its emissions are still well below 1990 levels (Figure 3). Putin has other things to worry about anyway.
The other developing countries, which collectively contribute 26% of global emissions, include some in a reasonably advanced state of economic development, such as South Korea and Chile, but otherwise are mostly poor. The poor countries are more than willing to limit their emissions provided the developed countries pay all the costs, and in 2011 the Green Climate Fund was set up to get the ball rolling. So far, however, contributions amount to only $10 billion – a negligible sum relative to the scale of the undertaking. We can safely assume that funds on the scale necessary to reverse the 3% historic annual growth rate in other developing country emissions will not be made available, or at least not quickly enough to do any good.
The bottom line is that the developed countries won’t commit to emissions cuts of the magnitude necessary to stay below the 2C threshold unless the developing countries shoulder at least some of the burden, but the developing countries aren’t going to sacrifice economic development on the altar of climate change, threshold or no threshold. The most they are likely to agree to is token measures that get good publicity but which don’t cut emissions, as China has already done. As a result the developed countries will again be left to go it alone, which as shown in Figure 6 is an exercise in futility:
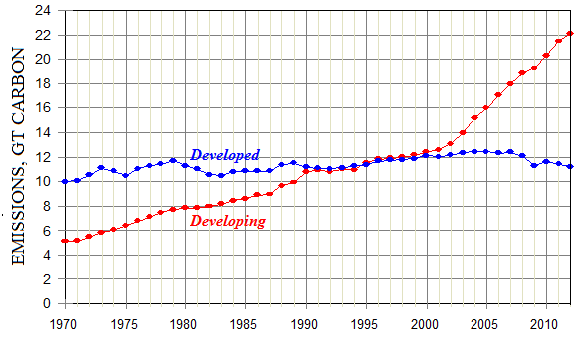
Figure 6: Developed and developing country carbon emissions, 1970-2012
The conclusion is inescapable. However desirable it may be to protect the Earth from the dire consequences of a runaway climate the chances that the world will agree to cut its emissions quickly enough to stay below the 2C threshold are somewhere between zip, zilch and zero. (There’s also the question of whether cuts of the magnitude necessary would be politically, economically and technologically achievable if the world does agree, but we’ll leave it aside here.)
Now imagine that you are one of the prominent politicians – Obama, Kerry, Merkel, Ban Ki-moon, Hollande, Cameron, Davey, whoever – who have publicly and repeatedly stated that climate change is the greatest threat facing the world, that the world is in serious trouble if nothing is done to stop it but that a solution is still within our reach. What do you tell people when next year’s make-or-break Paris climate talks show that it isn’t?
This is an article from our friend Euan Mearns’ site, Energy Matters, written by Euan’s co-conspirator, Roger Andrews. It was originally published here.
By Raul Ilargi Meijer
Website: http://theautomaticearth.com (provides unique analysis of economics, finance, politics and social dynamics in the context of Complexity Theory)
Raul Ilargi Meijer Archive |
© 2005-2022 http://www.MarketOracle.co.uk - The Market Oracle is a FREE Daily Financial Markets Analysis & Forecasting online publication.


