ECB Euro-zone QE Money Printing Program Taking Shape
Interest-Rates / Central Banks Jan 17, 2015 - 06:52 PM GMTBy: Dan_Norcini
 More and more it appears as if we are going to get some form of QE next week out of the ECB. The big question is the size and scope of the program that most expect to be announced.
There has been some discussion as to whether the ECB would buy various government bonds across the board or whether the actual Central Banks of the respective Euro zone nations would buy their own government bonds as the composition of the actual bond buying program.
Apparently there is a political dimension to any sort of widespread ECB bond buying as the largest nation in the Eurozone in terms of its ECB capital shares and overall economy, Germany, stands to bear the greatest risk should any one nation default on its bonds and be unable to repay the ECB. Germany would be the chief nation that would have to step up to try to make this good, thus the Germans are understandably concerned about this.
What appears to be shaping up, according to a report in Der Spiegel, is that each national central bank would be able to purchase up to 20%-25% of its outstanding national debt. That would spread the risk around the Eurozone and assuage some of Germany’s concerns.

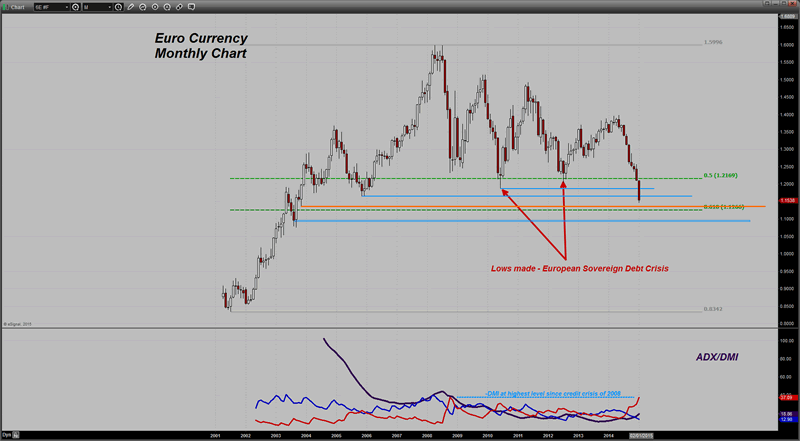
The Euro has continued to fall sharply in today’s session and has hit a TWELVE YEAR LOW against the US Dollar, having broken well below the lows made during the worst of the European Sovereign debt crisis.
In looking at some possible support zones that might temporarily stem the bleeding, we have that November 2003 low near the 1.1400 level. Below that is Fibonacci retracement support at the 61.8% level near 1.1266.
The ADX line is rising indicating that this is something that has the potential to be a long term trend. That is being confirmed by the highest level in the Negative Directional Movement Indicator ( -DMI) since 2008, during the height of the US credit crisis and the huge Yen carry trade unwind.
The short euro trade is a very large sized trade at this moment as traders pile in to take advantage of what they believe will be a move by the ECB on the QE front. I have read some comments from some, and I tend to agree with them, that to keep the market happy, the program will need to be somewhere near the equivalent of $1 trillion US. That has been close to the size of most of the Fed’s programs.
Anything less than that or of insufficient scope in traders’ minds to actually produce a tangible result, is going to leave the market disappointed. With last night’s Eurozone inflation numbers on everyone’s mind, the pressure is on the ECB to come up with something that will produce the intended effect.
QE programs, no matter what we might think of their merits or lack thereof, have been effective at halting the downward slide in both the UK and US economies. The jury is still out on the Japan experiment but it does seem to have at least halted the slide there to some extent. The market is hoping that an ECB version will have similar results as they are desperate to avoid job losses in the Eurozone that would inevitably accompany an disinflationary environment.
What the hope is that the sinking crude oil prices will have a positive impact on both business and consumers in the energy dependent Eurozone while simultaneously getting a boost from a QE program. That grand experiment continues…

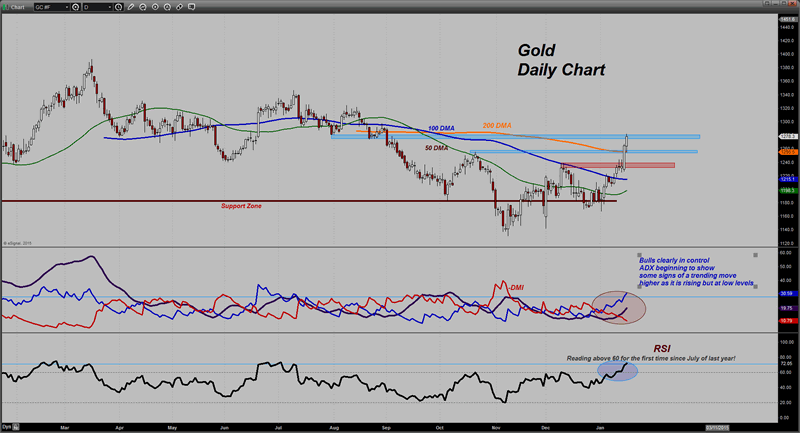
Meanwhile gold is enjoying this as it has worked right to the top of a major chart resistance level. That is the last thing standing between it and a potential run to near the psychological $1300 level. AS you can see on the chart, it is above the 200 day moving average now for the first time since August of last year.

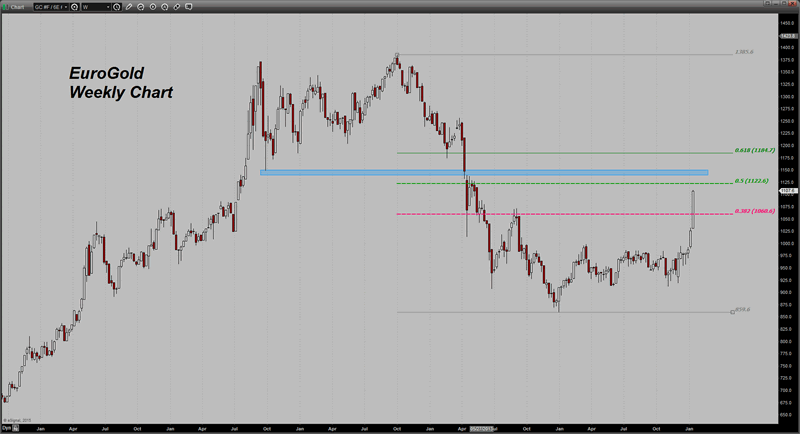
It has already pushed past the 1100 Euro level on the Eurogold chart. It has overhead resistance at the KEY 50% Fib retracement near 1122. Just above that lies horizontal resistance that stiffens as one nears the round number 1150 region.
Dan Norcini
Dan Norcini is a professional off-the-floor commodities trader bringing more than 25 years experience in the markets to provide a trader's insight and commentary on the day's price action. His editorial contributions and supporting technical analysis charts cover a broad range of tradable entities including the precious metals and foreign exchange markets as well as the broader commodity world including the grain and livestock markets. He is a frequent contributor to both Reuters and Dow Jones as a market analyst for the livestock sector and can be on occasion be found as a source in the Wall Street Journal's commodities section. Trader Dan has also been a regular contributor in the past at Jim Sinclair's JS Mineset and King News World as well as may other Precious Metals oriented websites.
Copyright © 2015 Dan Norcini - All Rights Reserved
All ideas, opinions, and/or forecasts, expressed or implied herein, are for informational purposes only and should not be construed as a recommendation to invest, trade, and/or speculate in the markets. Any investments, trades, and/or speculations made in light of the ideas, opinions, and/or forecasts, expressed or implied herein, are committed at your own risk, financial or otherwise. The information on this site has been prepared without regard to any particular investor’s investment objectives, financial situation, and needs. Accordingly, investors should not act on any information on this site without obtaining specific advice from their financial advisor. Past performance is no guarantee of future results.
© 2005-2022 http://www.MarketOracle.co.uk - The Market Oracle is a FREE Daily Financial Markets Analysis & Forecasting online publication.


