


Stock Market Rocky Beginning to 2015
Stock-Markets / Stock Markets 2015 Jan 18, 2015 - 09:39 AM GMTBy: Tony_Caldaro

 The US market had another down week to extend the streak to three. The market started the week at SPX 2045, dropped to 2023 on Monday, rallied to 2057 on Tuesday, then hit 1988 on Wednesday and again on Friday, before ending the week at 2019. For the week the SPX/DOW lost 1.25%, the NDX/NAZ lost 1.60%, and the DJ World index lost 0.45%. On the economic front, negative reports outpaced positive reports by a wide margin for the first time in many months. On the uptick: business inventories, the NY FED and consumer sentiment. On the downtick: retail sales, export/import prices, the CPI/PPI, the Philly FED, industrial production, capacity utilization, the WLEI, and the monetary base; plus the treasury surplus declined and weekly jobless claims rose. Next week, a holiday shortened one, we have Leading indicators, several reports on housing, and the much awaited ECB meeting.
LONG TERM: bull market
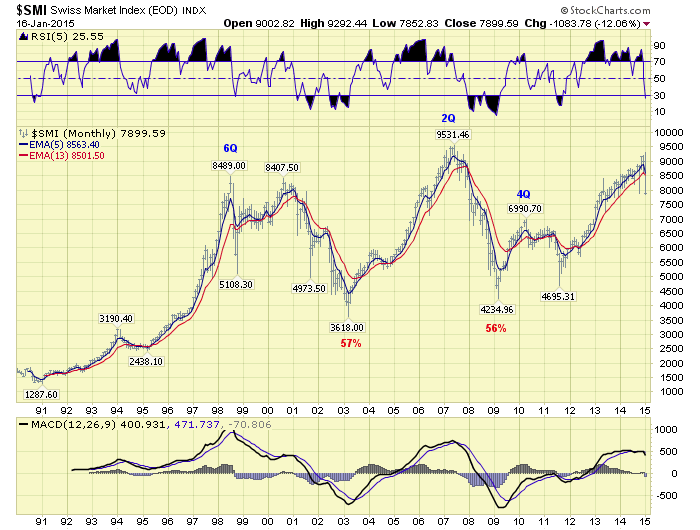
While every steep pullback/correction appears to bring out the perennial bears, we still see no signs of a bull market top. While the wave patterns in this 68 month bull market are quite extended. Our long term indicators do not yet suggest a Primary III high, let alone a bull market high. There was, however, a currency event this week when the Swiss National Bank removed their EURCHF 1.20 peg – which they have had since 2011. This resulted in an 18% surge in the Swiss Franc, and a 13% decline in the SMI. Putting that market into Primary wave IV. Normally the SMI tops, in its wave structure, months ahead of the US. Its Primary I occurred in 2010, four quarters ahead of the US Primary I high. Its 2007 bull market ended two quarters ahead of the US, and its 2000 bull market ended six quarters ahead of the US. This price/time relationship suggests the US Primary III should occur some time this year, or next.
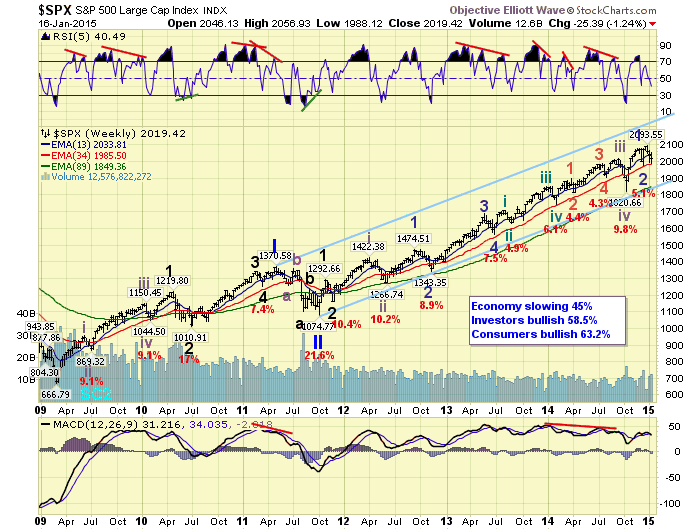
In the US, we continue to label this long term uptrend from 2009 as a five Primary wave bull market. Primary waves I and II ended in 2011, and Primary wave III has been underway since then. Primary I naturally divided into five major waves, but had a subdividing Major 1 and simple Major waves 3 and 5. Primary III, however, has had a simple Major wave 1, and an ever extending Major wave 3. It is possible that Major wave 3 ended in early December and we are currently in an irregular Major wave 4 correction. This count is carried on the SPX daily chart. Or, Intermediate wave v of Major wave 3 is still extending. This count is carried on the SPX hourly chart. Either way we should see new all time highs before Primary wave III ends. Then after a Primary IV correction, new highs for Primary V to end the bull market.
MEDIUM TERM: uptrend in jeopardy
The current uptrend began in mid-December at SPX 1973. The market then quickly rallied to new all time highs at SPX 2094 by late-December. After that the market started to pullback as 2015 began. And, the pullback became quite steep for an ongoing uptrend. i.e. 2094-1988 (5.1%). When one considers the recent early December correction was only 5.1%. Nevertheless, the uptrend has not broken down, nor has a new downtrend been confirmed as of today.
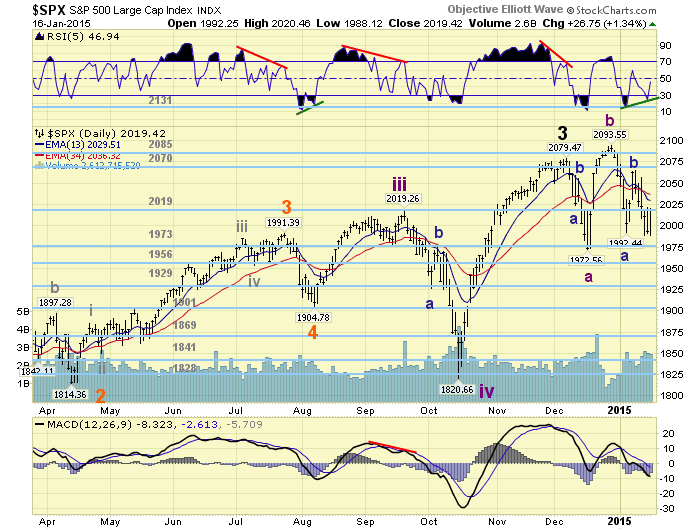
If we do get a downtrend confirmation then the count posted above would be the preferred count. The early December high would be counted as Major wave 3. Then the downtrend – uptrend – downtrend that followed would be counted as an irregular Major wave 4. Should this occur there are two levels of support to observe. The first is the 1973 and 1956 pivots, and the second the 1901 and 1869 pivots. Our indicators suggest the first levels of support should hold since this is an irregular correction. Normally we would be expecting about a 10% correction which suggests the second levels of support.
On Friday, however, the market displayed a positive hourly/daily divergence at the 1988 low. Then rallied quite strongly. Also at the low we had the typical MACD oversold condition for a correction, and a more oversold condition on the daily MACD than we had during the last correction. So it is possible this pullback has seen its low and the market moves higher from here. Medium term support is at the 1973 and 1956 pivots, with resistance at the 2019 and 2070 pivots.
SHORT TERM
After the SPX 2094 high in late-December the market sold off in what looks like an abc pattern into the early January 1992 low. Then after a rally to SPX 2064 the market became wildly volatile as it headed lower again. On a very short term scale it was quite choppy with many reversals. On our short term charts it appeared as a small abc down which formed a flat at SPX 2023. Then after a rally to 2057, another flat was formed at 1988 on Friday. Quite a complex pattern. Nevertheless the market rallied from that low, but ran into resistance at the 2019 pivot just before the close.
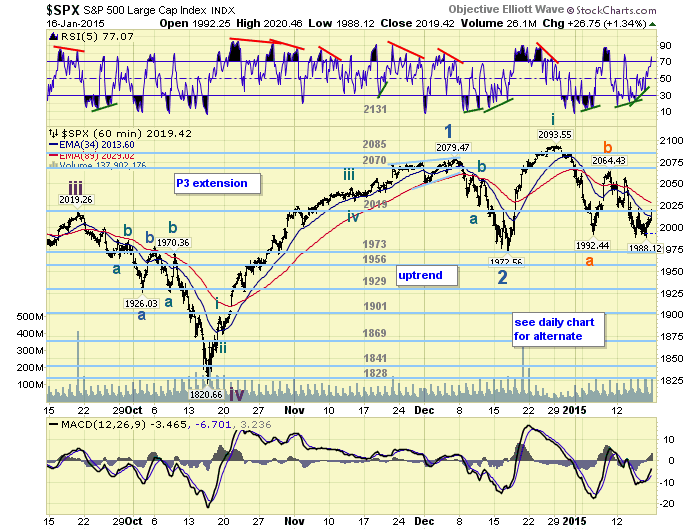
If this was the pullback low to end Minute wave ii, as displayed on the above hourly chart. Then the market should now be rising in Minute wave iii. Should the market roll over and drop below SPX 1988, then the count posted above in the medium term section is probably underway. Short term support is at SPX 1988 and the 1973 pivot, with resistance at the 2019 pivot and SPX 2057. Short term momentum ended the week overbought.
FOREIGN MARKETS
Asian markets were mixed on the week and lost 0.4%.
European markets were nearly all higher and gained 1.7%, despite the 13.3% loss in the SMI.
The Commodity equity group were mixed losing 0.7%.
The DJ World index lost 0.45%.
COMMODITIES
Bonds continued their uptrend gaining 0.9%.
Crude continues to downtrend, but gained 1.5%.
Gold is still in an uptrend and gained 4.7%.
The USD is in an eigth month uptrend and gained 0.9%.
NEXT WEEK
Monday: markets are closed. Tuesday: the NAHB index and a speech from FED governor Powell at 10am. Wednesday: Housing starts and Building permits. Thursday: the ECB meets, weekly Jobless claims and the FHFA housing index. Friday: Existing home sales and Leading indicators. Best to your extended weekend and week!
CHARTS: http://stockcharts.com/public/1269446/tenpp
http://caldaroew.spaces.live.com
After about 40 years of investing in the markets one learns that the markets are constantly changing, not only in price, but in what drives the markets. In the 1960s, the Nifty Fifty were the leaders of the stock market. In the 1970s, stock selection using Technical Analysis was important, as the market stayed with a trading range for the entire decade. In the 1980s, the market finally broke out of it doldrums, as the DOW broke through 1100 in 1982, and launched the greatest bull market on record.
Sharing is an important aspect of a life. Over 100 people have joined our group, from all walks of life, covering twenty three countries across the globe. It's been the most fun I have ever had in the market. Sharing uncommon knowledge, with investors. In hope of aiding them in finding their financial independence.
Copyright © 2015 Tony Caldaro - All Rights Reserved Disclaimer: The above is a matter of opinion provided for general information purposes only and is not intended as investment advice. Information and analysis above are derived from sources and utilising methods believed to be reliable, but we cannot accept responsibility for any losses you may incur as a result of this analysis. Individuals should consult with their personal financial advisors.
Tony Caldaro Archive |
© 2005-2022 http://www.MarketOracle.co.uk - The Market Oracle is a FREE Daily Financial Markets Analysis & Forecasting online publication.