


Gold and Silver at Crucial Point Between Bull and Bear
Commodities / Gold & Silver Jun 01, 2008 - 01:48 PM GMTBy: Merv_Burak

It was a bad week but not yet a disaster.
Illness in the family. Commentary will be short.
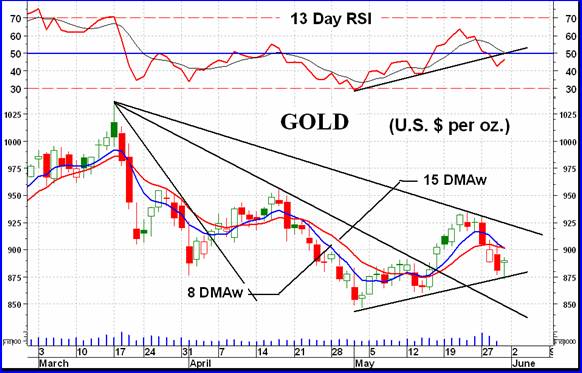
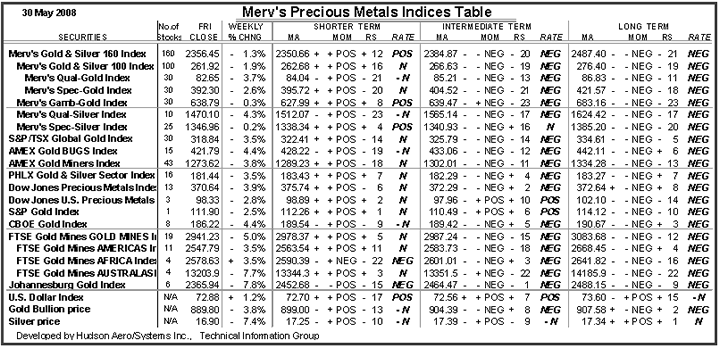
GOLD: LONG TERM For the next few weeks, time will not permit a detailed review of the precious metals market. I would recommend that readers go to the TABLE of Precious Metals Indices for a view of the technical information about the various Indices and markets.
Just a few words, although the gold price seemed to have had a good rally over the past year the move was not accompanied by any real strength. One might almost view it as a last grasp at the bull for a while. As mentioned in previous commentaries the long term P&F chart has already gone bearish. As for the charts and indicators, well that depends upon what one is looking at. The TABLE uses somewhat more aggressive indicators than I usually use for the analysis. These more aggressive long term indicators have already gone bearish while the less aggress ones I use every week for these commentaries have not yet gone that route, but are moving in that direction.
INTERMEDIATE TERM
Although the rally of a few weeks back looked like the real thing it petered out and turned the indicators back to the bear side. Those FAN trend lines have now confirmed the third FAN line which needs to be breached for any confirmation of an intermediate term bull. In the mean time we are back to the bear.
SHORT TERM
As the chart shows, we seem to be at a crucial point. Gold has reacted lower giving us that third FAN trend line and now has bounced off the short term support trend line for what may be the start of a new rally and intermediate term bull attempt. A move below the support trend line may see a test of the previous early May low while a continued up move through the third FAN trend line may see another attempt at new all time highs. I don't like that high volume on the Tuesday plunge but let's see what happens next.
SILVER
The analysis for silver is very much the same as for gold except that silver seems to have had a more emphatic negative move recently than did gold. It is closer to its previous lows and looks slightly weaker than gold.
PRECIOUS METAL STOCKS
I know that the vast majority of precious metal enthusiasts go to the two or three major North American Gold Indices for their information as to what the gold stocks are doing. Those Indices have had a good rally into new all time highs over the past year. However, as I have so often mentioned those Indices give a huge weight to the largest component stocks and little weight to the smaller stocks in their Indices. So, in effect, their Indices are basically a view of what the few large gold stocks are doing.
The Merv's Indices are based upon the AVERAGE weekly performance of all the component stocks with no stock being given greater or lesser weight towards the Index value.
Which method of Index calculation is best? Well that's a personal preference. Both methods have their benefits and problems.
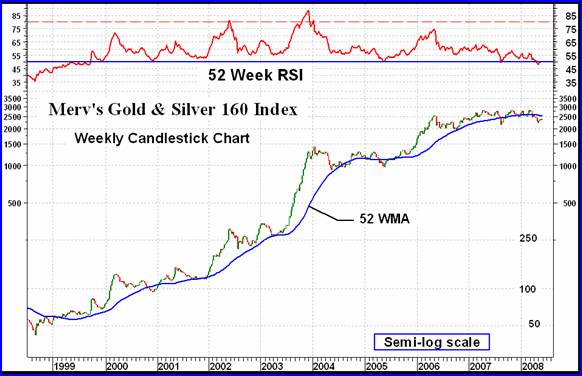
The Merv's Gold & Silver 160 Index is an Index of 160 gold and silver stocks, including the top 100 traded stocks on the North American exchanges by market value. Very quickly, the two most interesting and important features of the accompanying chart are the chart itself and the momentum indicator.
Despite the fact that the major Indices have had a good run over the past year the Merv's 160 Index shows the average gold and silver stock going through a MAJOR topping process.over the past year, year and a half. The major trend has now turned to the down side with the very long term 52 week moving average line turning downward with the Index action. As for the very long term 52 week RSI, that has been showing the continued weakness in the Index action since reaching its peak in early 2004. Even during the past year or so as the Index was making an attempt to gain altitude the momentum indicator was showing continuing weakness. For the first time since the start of the bull market in these stocks in 1999 the very long term momentum indicator has gone negative, below its 50% level.
For long term “investors” this does not seem to be the time to be making any new “investments” and, in fact, it might be a more appropriate time to be considering divesting instead.
Of course, nothing is for certain. Things could change quickly and the weakness over the past year could quickly turn to strength. That's why one goes with the flow and should the flow change, one would change with it. However, most money lost in the markets are lost when one tries to go against the flow.
Merv's Precious Metals Indices Table
That's it for this simplified week.
By Merv Burak, CMT
Hudson Aero/Systems Inc.
Technical Information Group
for Merv's Precious Metals Central
For DAILY Uranium stock commentary and WEEKLY Uranium market update check out my new Technically Uranium with Merv blog at http://techuranium.blogspot.com .
During the day Merv practices his engineering profession as a Consulting Aerospace Engineer. Once the sun goes down and night descends upon the earth Merv dons his other hat as a Chartered Market Technician ( CMT ) and tries to decipher what's going on in the securities markets. As an underground surveyor in the gold mines of Canada 's Northwest Territories in his youth, Merv has a soft spot for the gold industry and has developed several Gold Indices reflecting different aspects of the industry. As a basically lazy individual Merv's driving focus is to KEEP IT SIMPLE .
To find out more about Merv's various Gold Indices and component stocks, please visit http://preciousmetalscentral.com . There you will find samples of the Indices and their component stocks plus other publications of interest to gold investors.
Before you invest, Always check your market timing with a Qualified Professional Market Technician
Merv Burak Archive |
© 2005-2022 http://www.MarketOracle.co.uk - The Market Oracle is a FREE Daily Financial Markets Analysis & Forecasting online publication.