There’s More to the Gold Price Rally Than European Market Fears
Commodities / Gold and Silver 2015 Jan 28, 2015 - 10:41 AM GMTBy: Frank_Holmes

 Gold was down 1.72 percent at the end of 2014, but things are looking up for the yellow metal. Last week I returned from presenting at the Vancouver Resource Investment Conference, where sentiment for gold was through the roof.
And with good reason. Even though gold was down last year, it still ranked as the second-best-performing currency following the U.S. dollar. The metal has risen about 10 percent year-to-date, and last Tuesday, for the first time since mid-August, it broke through the $1,300 mark.
Are you excited yet?
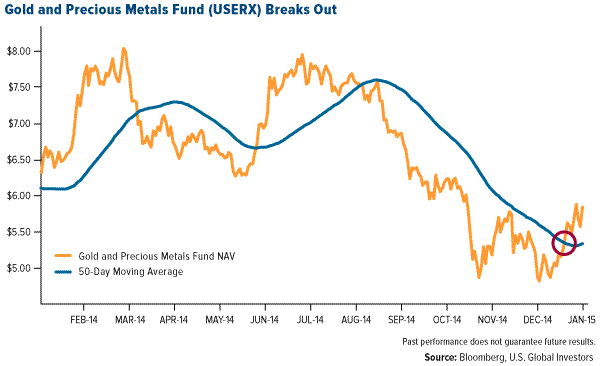
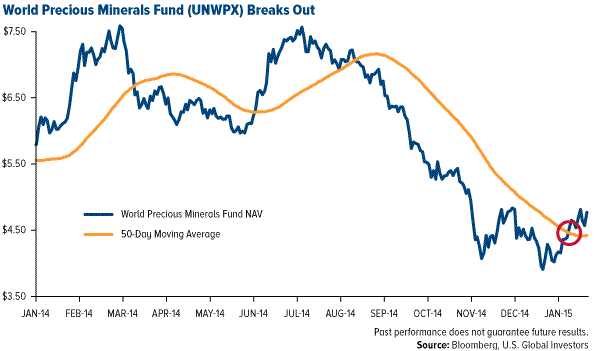
Our two gold funds, the Gold and Precious Metals Fund (USERX) and World Precious Minerals Fund (UNWPX), have responded positively to the rally. Both have jumped above their 50-day moving averages, a key trend indicator many investors use to decide when to allocate assets.
You’ve probably heard or read that gold’s breakout is a direct result of what’s currently happening in Europe, but there’s much more to the story.
To be clear, the events I’m referring to are a huge deal and shouldn’t be discounted. As we say at U.S. Global Investors, government policy is a precursor to change, and certainly gold has struck a musical chord in the world of currency symphonies.
The European Central Bank’s (ECB’s) unveiling of a much-needed, trillion-dollar quantitative easing (QE) program will hopefully lead to a stronger economy in the eurozone. For two years now, it seems the region has held much of the world hostage with its lack of growth.
Switzerland unexpectedly unpegged its currency, the Swiss franc, from the euro, shocking money managers all over the world. The country also let its 10-year government bond yield sink into negative territory, joining Germany, Spain and Italy, whose yields now hover near record lows. This makes other assets, especially gold, look much more attractive.
And in Greece, the radical far-left, anti-austerity Syriza party just took control of the government, sending shockwaves throughout the European markets and raising the possibility that the Mediterranean country might leave or be booted out of the eurozone.
All of these developments have spurred investors to seek safety in gold. But there’s more at work fueling the metal’s ascent.
Currency Wars
As I’ve discussed many times before, the strong U.S. dollar—it’s currently up 2.2 standard deviations for the 10-year period—has not only weighed on crude oil but also caused other global currencies to depreciate. Both have helped many foreign gold producers expand their profit margins, as bullion is then able to gain in value more quickly.
“The Canadian dollar has weakened quite a bit against the U.S. dollar for a lot of our gold stocks in Canada,” Ralph Aldis, portfolio manager of our gold funds, explained during our most recent webcast. “These producers benefit when the local currency depreciates.”
This is because they pay their workers in the weaker local currency but sell their bullion in U.S. dollars.
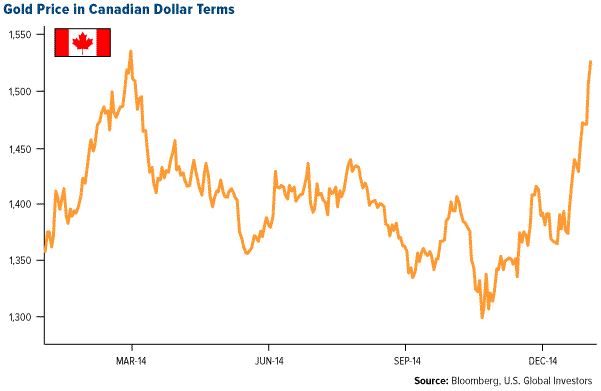
When expressed in Canadian dollars, gold has sharply ramped up to a nine-month high:
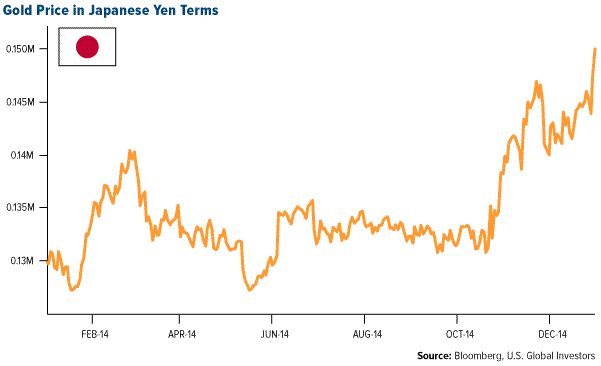
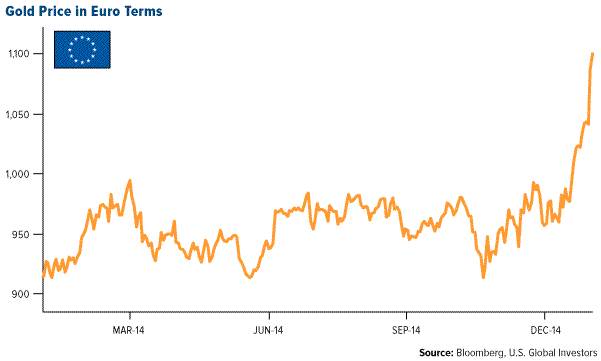
Gold has also shot upward in Japanese yen and euro terms:
A weaker South African rand has been a tailwind for two of our South African holdings, Gold Fields and Harmony Gold Mining. Below you can see that both companies have broken free of their 50-day moving averages—by a much wider spread than we’ve seen since at least March of last year.
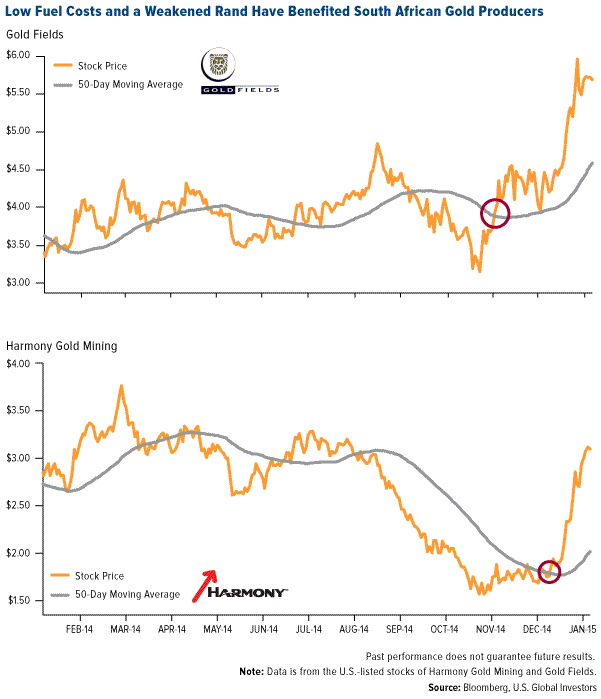
Then there are falling fuel costs, ordinarily gold miners’ biggest expense.
“If you factor in lower energy prices, that basically gives companies a double whammy in terms of margin expansion,” Ralph said.
Headquartered in Toronto, Barrick Gold, the world’s largest gold producer, saves about $25 per ounce on lower diesel expenses, according to BullionVault.
Before it started recovering at the beginning of January, gold had been pretty banged up since mid-August. As a result, companies have slashed capital spending, especially the junior miners.
But recently we’ve seen merger and acquisition (M&A) activity in the gold space, typically a good sign. In late November, Osisko Gold Royalties announced it would buy Quebec City-based Virginia Mines for $424 million, and last week we learned that Vancouver-based Goldcorp will be acquiring precious metals explorer Probe Mines for $440 million. Probe is a relatively new player in the field, having made two discoveries in Ontario since 2009.
This makes sense. If you’re looking to expand your company, you might as well do it when everything’s on sale. But these M&As also indicate that there’s enough confidence in the future of the precious metals industry to justify such capital spending. It says a lot about the market that Goldcorp would agree to purchase a younger exploration company, a move we haven’t seen in a while.
Repatriation Games
This is what largely drives gold demand: confidence in the metal as a store of value, in good times and in bad. Gold is much more than a commodity—it’s a form of currency, one that “has never required the credit guarantee of a third party,” as former Federal Reserve Chair Alan Greenspan made clear in September.
Last year, gold was the second-strongest currency in the world, trailing only the U.S. dollar. It’s amazing how well it held up under the pressure of the greenback. Not just investors but also central banks recognize this.
“If the dollar or any other fiat currency were universally acceptable at all times,” Greenspan said, “central banks would see no need to hold any gold. The fact that they do indicates that such currencies are not a universal substitute.”
Indeed, we’re seeing central banks all around the world shoring up their own gold reserves by repatriating bullion from foreign institutions. December saw the biggest monthly outflow of gold from the New York Fed since 2001, bringing its holdings to their lowest level this century.
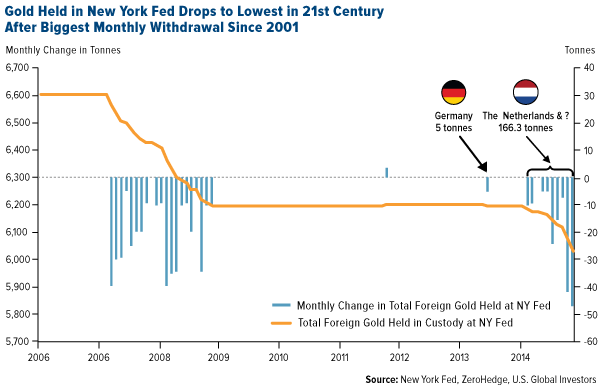
Central banks might be jittery from global growth concerns—the International Monetary Fund just downgraded its growth forecast for 2015—or simply recognizing the tenuousness of fiat money. Either way, the message is resounding: gold is an essential component to a strong portfolio and an excellent store of value.
As always, we recommend a 10-percent weighting in gold: 5 percent in bullion, 5 percent in gold stocks, then rebalancing every year.
I’ll have more to share with you when I return this week from Zurich, where I’m be presenting at its International Business School.
Please consider carefully a fund’s investment objectives, risks, charges and expenses. For this and other important information, obtain a fund prospectus by visiting www.usfunds.com or by calling 1-800-US-FUNDS (1-800-873-8637). Read it carefully before investing. Distributed by U.S. Global Brokerage, Inc.
Total Annualized Returns as of 12/31/2014
Fund |
One-Year |
Five-Year |
Ten-Year |
Gross Expense Ratio |
Expense Cap |
Gold and Precious Metals Fund (USERX) |
-14.00% |
-15.67% |
0.38% |
2.15% |
1.90% |
World Precious Minerals Fund (UNWPX) |
-16.52% |
-18.79% |
-2.57% |
1.86% |
n/a |
Expense ratios as stated in the most recent prospectus. The expense ratio after waivers is a voluntary limit on total fund operating expenses (exclusive of any acquired fund fees and expenses, performance fees, taxes, brokerage commissions and interest) that U.S. Global Investors, Inc. can modify or terminate at any time, which may lower a fund’s yield or return. Performance data quoted above is historical. Past performance is no guarantee of future results. Results reflect the reinvestment of dividends and other earnings. For a portion of periods, the fund had expense limitations, without which returns would have been lower. Current performance may be higher or lower than the performance data quoted. The principal value and investment return of an investment will fluctuate so that your shares, when redeemed, may be worth more or less than their original cost. Performance does not include the effect of any direct fees described in the fund’s prospectus (e.g., short-term trading fees of 0.05%) which, if applicable, would lower your total returns. Performance quoted for periods of one year or less is cumulative and not annualized. Obtain performance data current to the most recent month-end at www.usfunds.com or 1-800-US-FUNDS.
Want to receive more commentaries like this one? Sign up to receive email updates from Frank Holmes and the rest of the U.S. Global Investors team, follow us on Twitter or like us on Facebook.
By Frank Holmes
CEO and Chief Investment Officer
U.S. Global Investors
U.S. Global Investors, Inc. is an investment management firm specializing in gold, natural resources, emerging markets and global infrastructure opportunities around the world. The company, headquartered in San Antonio, Texas, manages 13 no-load mutual funds in the U.S. Global Investors fund family, as well as funds for international clients.
All opinions expressed and data provided are subject to change without notice. Some of these opinions may not be appropriate to every investor.Standard deviation is a measure of the dispersion of a set of data from its mean. The more spread apart the data, the higher the deviation. Standard deviation is also known as historical volatility. All opinions expressed and data provided are subject to change without notice. Some of these opinions may not be appropriate to every investor. The S&P 500 Stock Index is a widely recognized capitalization-weighted index of 500 common stock prices in U.S. companies. The NYSE Arca Gold BUGS (Basket of Unhedged Gold Stocks) Index (HUI) is a modified equal dollar weighted index of companies involved in gold mining. The HUI Index was designed to provide significant exposure to near term movements in gold prices by including companies that do not hedge their gold production beyond 1.5 years. The MSCI Emerging Markets Index is a free float-adjusted market capitalization index that is designed to measure equity market performance in the global emerging markets. The U.S. Trade Weighted Dollar Index provides a general indication of the international value of the U.S. dollar.
Frank Holmes Archive |
© 2005-2022 http://www.MarketOracle.co.uk - The Market Oracle is a FREE Daily Financial Markets Analysis & Forecasting online publication.


