To Create Unlimited Market Liquidity or Not; That Is the Question
Stock-Markets / Liquidity Bubble Jan 30, 2015 - 10:06 AM GMTBy: Doug_Wakefield
"On October 15, 2014 between 9:33 and 9:45, liquidity evaporated in Treasury futures and prices skyrocketed (causing yields to plummet). Five minutes later, prices returned to 9:33 levels.
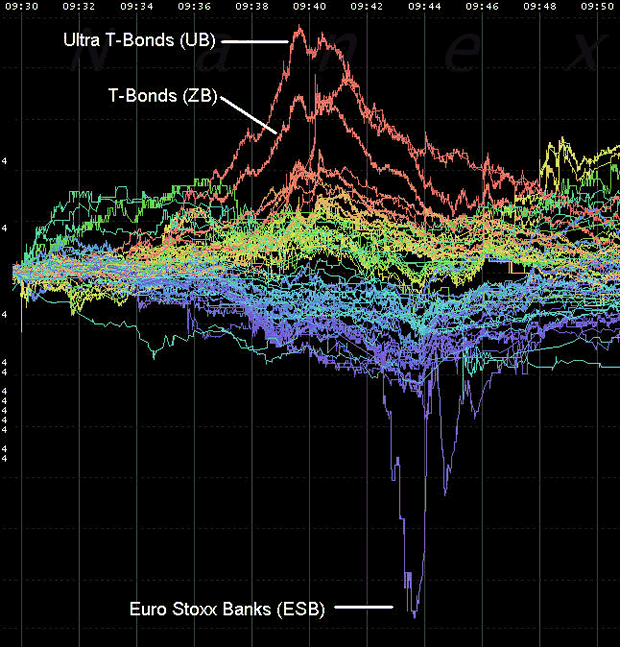
Trading activity was enormous, sending trade counts for the entire day to record highs - exceeding that of the Lehman collapse, the financial crisis and the August 2011 downgrade of U.S. debt. Treasury futures were so active, they pushed overall trade counts on the CME to a new record high." [Underlined text my own, Nanex Research, Oct 15 '14, Treasury Flash Crash]
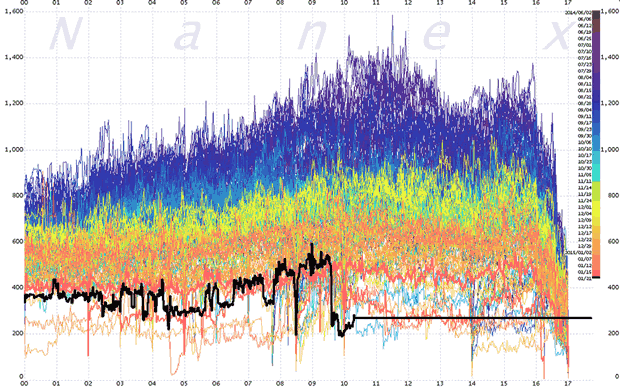
"In what is likely an effort to comprehend whether the market is satiated with a mere EUR 50 billion per month in printed money, this morning's leaked ECB QE announcement (due tomorrow) sparked total chaos in FX markets and, as Nanex notes, sending market liquidity to near record lows. This is a problem. With the 'real' volatility event not arriving until tomorrow, everyone has pulled out of the market already... setting the scene for a gappy Swissnado replay tomorrow morning." [Underlined text my own, All Liquidity Disappears From Euro FX Market Day Ahead of ECB Announcement, Zero Hedge, January 21, 2015]
Two powerful ideas collide in our heads. The most dominant by the financial media and central banks, is the relentless pursuit of "overcoming deflation" with "unlimited money".
The other is a lesser known idea, that the more trades are pushed in the same direction and the longer this takes place, the more apt markets are to reach a point when either the demand to get in or get out produces a lack of liquidity in that market.
History has already left us a highly studied event that took place on May 6, 2010, that most know today because it became the ultimate example of a new term known as the "flash crash", a topic I have mentioned in several articles.
"I.3. A LOSS OF LIQUIDITY - Since the E-Mini and SPY both track the same set of S&P 500 stocks, it can be expected that prices of these products would move in tandem during their rapid decline. However, a detailed examination of the order books15 for each product reveals that in the moments before prices of the E-Mini and SPY both hit their intra-day lows, the E-Mini suffered a significant loss of liquidity during which buy-side market depth16 was not able to keep pace with sell-side pressure. In comparison, buy-side liquidity in SPY reached its low point for the day a few minutes later, after prices in both the E-Mini and SPY began to recover." [ Securities and Exchange Commission's joint paper with the Commodity Futures Trading Commission, Findings Regarding the Market Events of May 6, 2010, released Sept 30, '10, pg 11]
Most individuals, living their daily lives outside the world of trading and financial systems, have probably never considered this critical question, must less even know it is a question to ask.
Yet think about it. If you continue to tell a crowd of people, "here comes another bucket of QE (cheap money)", why would the experience of the last 3 years tell us anything but, "there is plenty of liquidity to speculate, and central bankers want us to 'feel wealthier, so we will go out and borrow and spend', so why worry?
A massive loss of liquidity during times of extreme stress in markets is actually a consequence of creating too much liquidity. The more people chase the same trend, the higher the leverage and the larger the trade, the more likely that at some point, the movements of the herd overwhelm the system.
If this happens over a few minutes, like those seen in US Treasuries on October 15th, or the euro on January 21st, then the public probably never even knows anything happened.
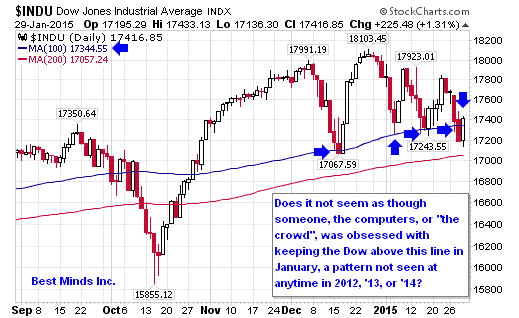
If the event makes history and brings about the most volatile day in US stocks on record to date, the May 6, 2010 Flash Crash, thus creating documentaries and investigations from the highest regulatory bodies in the US, then the public is made aware that there is a problem. However, we forget quickly as long as things return to "normal", i.e., computers keep bouncing stock indices upwards repeatedly at their "nirvana lines"?
But what happens if the idea of "risk on/risk off" becomes so dominant in the trading world, that an event escalates over several weeks into a crash, such as the 3,000-point drop from the high on Friday, Oct 3 '08 to the low on Friday, Oct 10' 08, or the largest percentage decline in a day (22%) on record, Black Monday, October 19, 1987? I know, we have learned from those mistakes.
What was seen as very good for rising stock markets, ever larger amounts of capital pouring in, now becomes a very nasty part of creating the inverse as stocks capital flows out, and the shift begins in earnest. Eventually, a critical week, day, or even few minutes can be reached, where all that liquidity is not available.
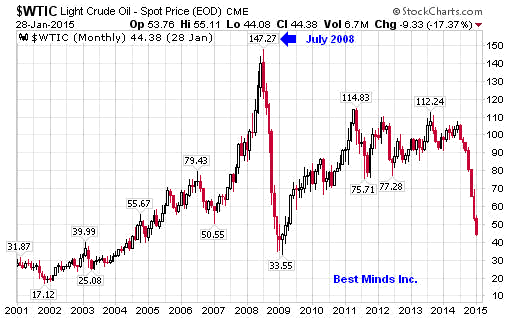
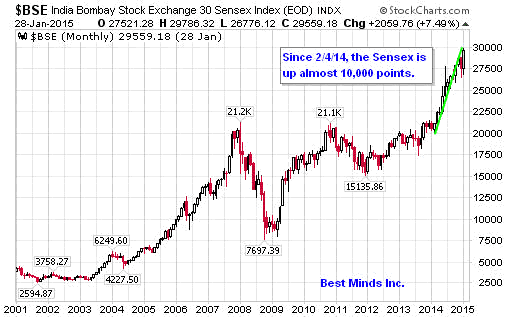
Eventually, all that massive amount of additional liquidity creates enormously lopsided trades in the largest markets in the world. A shift from one side of the boat to the other, impacts the entire global business world.
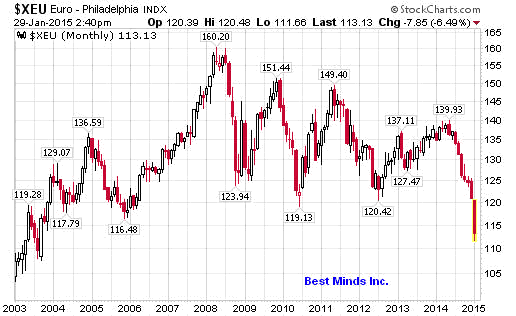
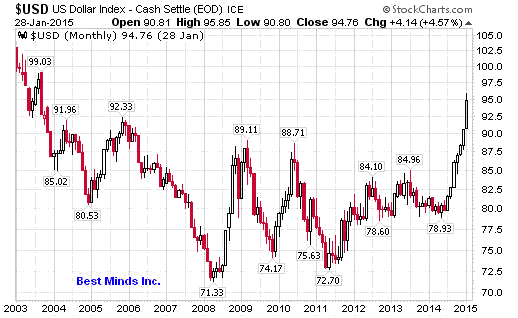
So while political and financial central planning leaders love to espouse the power of the "liquidity bazooka", we need to remember that there is a much larger story developing, and it most certainly is not how a bunch of global bureaucrats can make life and trading easier for the rest of humanity.
"In all, a massive bond buying bazooka of 1.1 trillion euros.
Markets were tipped off on the direction, but not the scale, of the program thanks to French President, Francois Hollande: 'On Thursday, the ECB will take the decision to buy sovereign debt, which will provide significant liquidity to the European economy and create a movement that is favourable to growth.'" [ECB Money Printing Now Expected to Top 1 trillion Euros, ABC News, Jan 21 '15]
I still remember researching the archives of The Investment Company Institute for capital flows into and out of stock funds when I first started tearing apart the markets at the system level in 2004, looking for patterns from the wild ride to the top and back to the bottom between the late 90s and 2003. What I noticed was that the capital flows into US based stock funds hit their highest on record in February 2000, the month before the NASDAQ's all time high that March, and the largest outflow the summer of 2002.
Record $36.5 billion flows into US- based funds in week: Lipper, CNBC, Dec 27 '14
"Investors in U.S.-based funds poured $36.5 billion into stock funds in the latest weekly period, marking the biggest inflows on record as U.S. stocks surged to record highs, data from Thomson Reuters Lipper service showed on Friday."
"Money has been flowing out of the major ETFs tracking the S&P 500. Over the past three weeks, more than $20 billion has left the funds, the 2nd highest amount in the past four years." [Jason Goepfert's Daily Sentiment Report, Jan 27 '15, www.sentimentrader.com]
The question should have never been about the "right" amount of liquidity, but why a system we espouse as "free markets" continues to need so much constant intervention, now in its 7th year since hearing the term "bailout".
I guess some things will never change....until put under enough pressure.
Being a Contrarian
I have found that using the "nirvana trade", one has been able to profit from being a contrarian as volatility has picked up greatly since mid 2014. January's extreme volatility should be a warning to everyone. Change is always inevitable, as demonstrated by centuries of market history.
The Investor's Mind was started in 2006, believing that asking questions was a good thing. 2015 seems set to prove why once again, like 2008.
The cost for procrastination continues to rise. The value for good research is extremely low in comparison to the speed in which wealth can be destroyed. Click here to start the next six months reading the newsletters and trading reports as we come through this incredible year.
On a Personal NoteI have recently started a blog called, Living2024. It is a personal blog, not business. I wanted to have a place to write some deeper stories about where this entire drama seems to be taking us all. I hope you will check it out.
Doug Wakefield
President
Best Minds Inc., a Registered Investment Advisor
2548 Lillian Miller Parkway
Suite 110
Denton, Texas 76210
www.bestmindsinc.com
doug@bestmindsinc.com
Phone - (940) 591 - 3000
Alt - (800) 488 - 2084
Fax - (940) 591 –3006
Copyright © 2005-2011 Best Minds Inc.
Best Minds, Inc is a registered investment advisor that looks to the best minds in the world of finance and economics to seek a direction for our clients. To be a true advocate to our clients, we have found it necessary to go well beyond the norms in financial planning today. We are avid readers. In our study of the markets, we research general history, financial and economic history, fundamental and technical analysis, and mass and individual psychology.
Disclaimer: Nothing in this communiqué should be construed as advice to buy, sell, hold, or sell short. The safest action is to constantly increase one's knowledge of the money game. To accept the conventional wisdom about the world of money, without a thorough examination of how that "wisdom" has stood over time, is to take unnecessary risk. Best Minds, Inc. seeks advice from a wide variety of individuals, and at any time may or may not agree with those individual's advice. Challenging one's thinking is the only way to come to firm conclusions.
Doug Wakefield Archive |
© 2005-2022 http://www.MarketOracle.co.uk - The Market Oracle is a FREE Daily Financial Markets Analysis & Forecasting online publication.


