


Gold Price Short-Term Bottom Due, Higher into February
Commodities / Gold and Silver 2015 Jan 30, 2015 - 02:07 PM GMTBy: Jim_Curry

 With the sharp selling in recent days, there is now the potential that another larger-degree peak has been seen in the Gold market. Having said that, this is not set in stone at the present time, and the various time cycles that I track suggest that we should be at or nearing at least a short-term bottom, with the potential for one final slingshot higher into early-to-mid February.
The Short-Term Cycles
Of the various cycles that I track for the Gold market, the two that are the most dominant are the 10 and 34 day cycles. In some of my daily reports last week, I pointed out that the short-term cycles were Gold were topping, and that a correction phase with the same was due into late-January. This was based primarily on my daily and weekly forecast path, which is shown on the chart below:
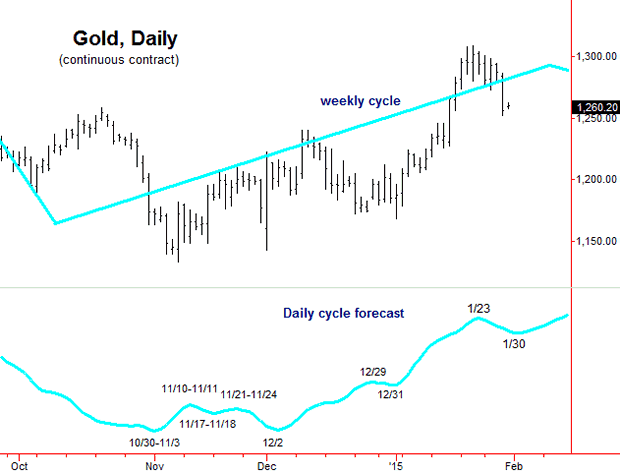
The daily/weekly forecast chart has continued to be very accurate in recent months, with the model looking for the last significant low around the 12/31/14 date, which was noted as being plus or minus a day or so in either direction. That low ended up being registered the very next trading day (1/2/15) at the 1168.50 figure (continuous contract), and saw prices rising nearly $140 in the following weeks, with the time projection having called for a high of some significance to be registered near 1/23/15. That high was made a day on the early side, set in place at the 1307.80 figure.
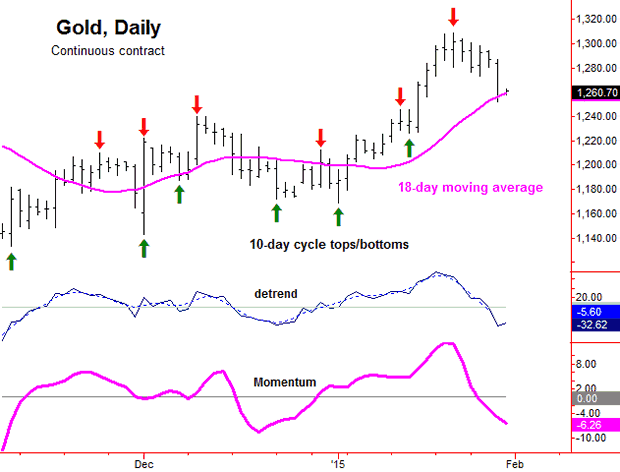
The daily cycle top that was due around the 1/23/15 timeframe was also expected to end up as the high for the earlier-noted 10-day cycle, which is shown on the next chart (below). In terms of price, I always note downside 'reversal points' for most of the turns, and with that I mentioned that a break below the 1278.10 figure would confirm a correction phase to be in progress for Gold, ideally into the late-January timeframe, plus or minus.
In terms of price with the above, the normal minimum magnet to the recent correction was the 18-day moving average, due to the fact that there is a less dominant 18-20 day cycle in the Gold market (one that appears to be coming back into dominance). With that, one of my rules is that a cycle will revert back to a moving average of the same length approximately 80-85% of the time or better, and with that the assumption was that the recent short-term decline phase would see a retracement back to the same.
Going a bit further, due to a larger-degree 154-day component (more on this in a bit), the overall assumption was that the current decline phase would see the 18-day average acting as a magnet - but would also end up as a countertrend affair, holding at or above the 1224.90 figure. In terms of time, the next projected low from our daily/weekly forecast model (noted earlier) is due around the January 30th date, but which does have a plus or minus variance of a day or so in either direction. With the above said and noted, there is at least some potential that Thursday's low of 1252.10 will end up as the bottom for this move, though that is too early to say with any degree of confidence.
Stepping back just slightly, if the current daily cycle downward phase does end up as a countertrend affair - as the probabilities do tend to favor - then the next short-term upward phase should take the metal back to or above the recent highs (1307.80, continuous contract). In terms of time, this peak could be made anywhere in the February 9-16 timeframe, a range of about a week overall.
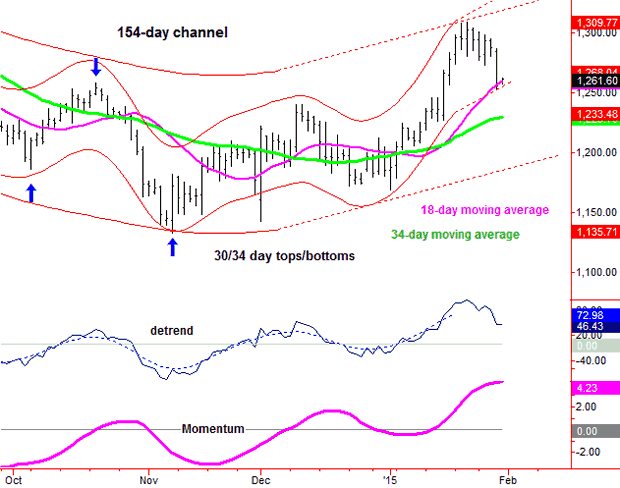
Stepping back further, the high that is registered into the month of February 'should' end up as the peak for at least the larger 34-day cycle, which is shown on the next chart (below). Following a peak with this 34-day wave, we should see, at minimum, a decline back to the 34-day moving average or lower as the smaller 34-day day wave next bottoms, which is currently due around the late-February or early-March timeframe.
The 154-Day Cycle
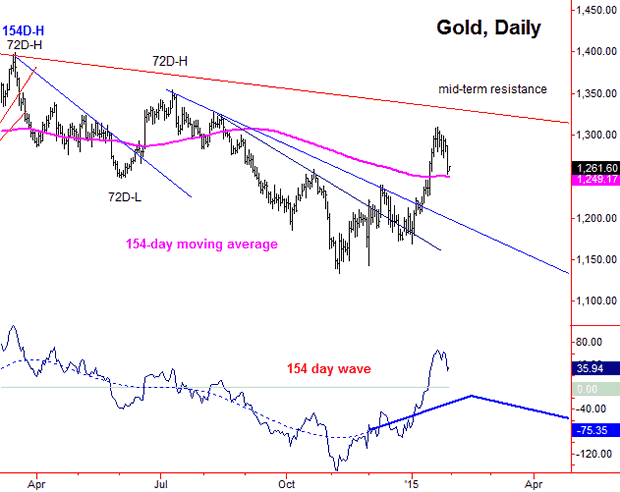
For the bigger picture, the next major peak for Gold has been expected to come from the larger 154-day cycle, which last bottomed at the 11/7/14 low of 1131.80. After this cycle was confirmed to have troughed, the statistical information in regards to the same told us that the normal low-end rallies had been around 12.7% or more before topping, which inferred a move up to the 1274 figure or better on the current upward phase of this wave - something which has obviously been satisfied with the recent action.
In terms of time, the greater-majority of the upward phases of this same 154-day cycle were noted as having lasted at least 2-3 months off the bottom before peaking, which favored strength into the mid-January timeframe, at minimum - something which we have also seen satisfied. With that, this cycle is now moving back into topping range, and could be primed to peak in the early-to-mid February region, should Gold manage to reverse back and make new highs for the bigger swing at or into the same. You can get a more clear view of this 154-day cycle on the chart below:
For the bigger picture, the overall assumption has been that the current 154-day cycle upward phase would hold at or well below the prior peak for this component, which is the March, 2014 high of 1400.60; however, it should ideally also remain at or below the July, 2014 top of 1354.40. If correct, then - following the pattern of a 'lower-high' - another sharp decline of 15-20% off the top is expected to unfold into April or May of this year, when yet another 154-day cycle bottom would be due. With that, there is still the potential for the metal to take out the 11/7/14 bottom in the coming months.
As a final note in regards to the bigger picture, I should add that any monthly (monthly bar) close above the 1330.00 figure for Gold - if seen at any point going forward - would likely void any potential for new lows being seen on the next 154-day downward phase into April/May. Going further, I should also point out that any reversal back below the 1166.50 figure (continuous contract) - should that be seen at any point - would be our confirmation that this wave has topped - a number which should continue to rise in the coming weeks, depending on the action seen in-between.
The Overall Bottom Line
The overall bottom line with the above is that a short-term cycle bottom is due anywhere in the current timeframe (i.e., January 30th, plus or minus), and - once complete - should give way to a sharp trading rally into around mid-February, plus or minus, a move that could still make a push back to or above the recent highs. From there, however, the probabilities will favor a more important peak forming with the 154-day cycle, which is due for a sharp correction off the top into the Spring of this year.
Jim Curry
Market Turns Advisory
Email: jcurry@cycle-wave.com
Jim Curry is the editor and publisher of The Gold Wave Trader, which specializes in the use of cyclic and statistical analysis to time the markets. He is also the author of several trading-related e-books, including ‘The Volatility Reversal Method’, also ‘Cycles & Moving Averages’. He can be reached at the URL above.
Copyright 2014, Jim Curry - Disclaimer - The financial markets are risky. Investing is risky. Past performance does not guarantee future performance. The foregoing has been prepared solely for informational purposes and is not a solicitation, or an offer to buy or sell any security. Opinions are based on historical research and data believed reliable, but there is no guarantee that future results will be profitable. The methods used to form opinions are highly probable and as you follow them for some time you can gain confidence in them. The market can and will do the unexpected, use the sell stops provided to assist in risk avoidance. Not responsible for errors or omissions.
JIm Curry Archive
|
© 2005-2022 http://www.MarketOracle.co.uk - The Market Oracle is a FREE Daily Financial Markets Analysis & Forecasting online publication.