


Crude Oil Price Capitulation Phase
Commodities / Crude Oil Feb 09, 2015 - 06:00 PM GMTBy: Bob_Loukas

 After a long and relentless decline, the Crude market has finally enabled us to anchor its Cycles. Up until 2 weeks ago, Crude was locked in a clear crash Cycle, which made it impossible to expect anything other than a continuation of the crash. But now that Crude has reversed with a 20% rally, its moves are clearly the start of a new intermediate term Cycle.
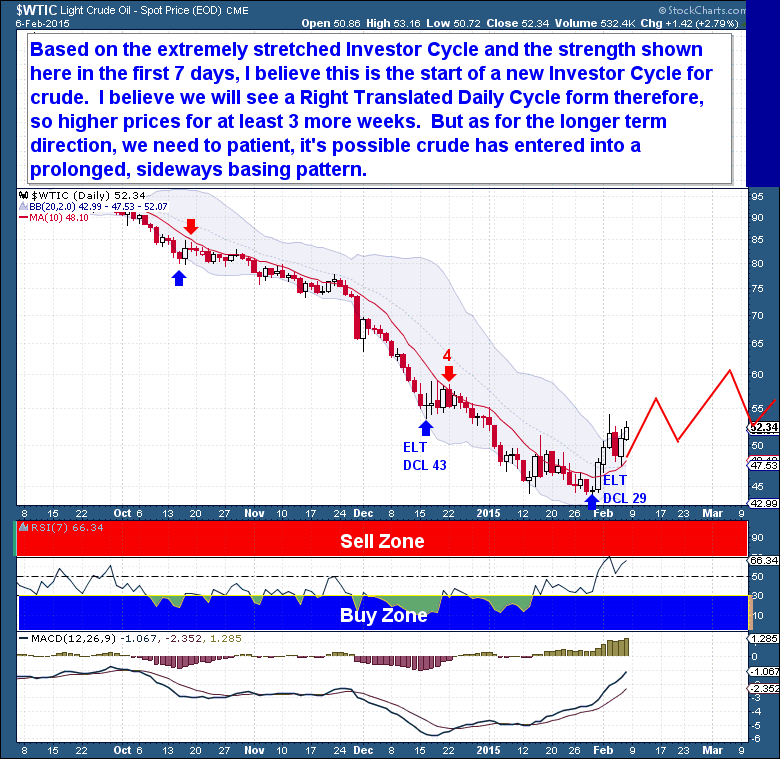
Based on the duration and the extreme nature of the recent Investor Cycle (IC) decline, Crude’s new-found strength is almost certainly the start of a new Investor Cycle. It’s impossible to know whether the current up-move will be only a counter-trend bounce, but because this is the 1st Daily Cycle of a new Investor Cycle, we should expect the current Cycle to be Right Translated (Meaning it will top beyond the midpoint of the Cycle).
On a longer time-frame though, I’m not convinced that the current 8 month downtrend has marked the bottom for Crude. The crash was supply-driven, and the underlying issue will take time to resolve. The genesis of the crash was excess investment in Crude production, which resulted in a supply glut that can only be solved through lower prices, over an extended period of time. Although the move down has been extreme, it’s a completely natural reaction to a significant supply/demand imbalance.
Three months of prices below production costs is not nearly enough time to have soaked up the current glut of supply. Oil firms have invested heavily in their production facilities, and want to be certain that the demand/supply dynamic is going to persist before shutting off production. And taking production offline is not immediate. It’s a lengthy process, with the decision to remove production leading market impacts by a significant length of time.
As with any bull market, Crude faces a situation where only time and repeated losses will cause participants to accept the market’s new reality. Any decision to close a facility is based primarily on expectations for longer term prices, and price expectations are always intensely biased to the upside at the end of a bull market. If Crude shows even a hint of a quick recovery in price, firms will be encouraged to “weather the storm”, only prolonging the extent and length of the decline.
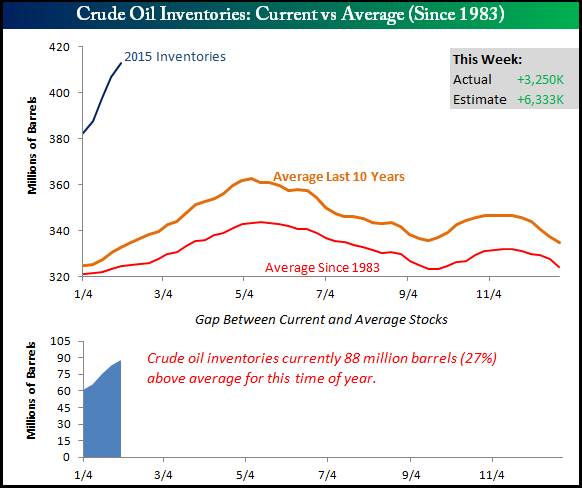
So long as the massive stockpile of Crude inventory persists, lower production will not – in the short term – correct the imbalance. What’s required will be for facilities to close, production to fall, and enough time to pass for the existing inventory to be worked down. Unfortunately, I believe that the imbalance is structural, so it cannot and will not be corrected quickly on the demand side. Until we see supply better reflect the true demand for Crude, there is little prospect of a longer term recovery in price.
Courtesy Bedspokeinvest
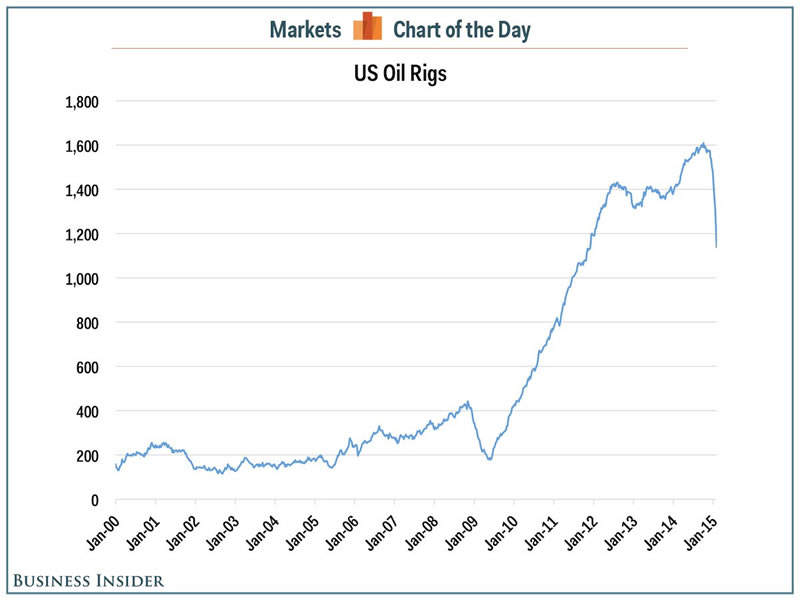
Bankruptcies and closures of Oil companies are underway, and this will help to reduce the supply imbalance. But this process will need much more time, possibly years, to play out. A look at the number of rigs in production makes it clear what led to the crash in prices. Between 2010 and 2014, there was massive over-investment in production, resulting in the addition of 4 million barrels of US Crude production per day. The result was the highest level of production in 30 years.
The current drop in rig counts has, so far, been about 30% from peak to trough. In past crashes, however, the rig count has declined by 50-60%. It takes time for any supply imbalance to work its way through the system because producers find it hard to shut down production. In some cases, producers even ramp up production in an attempt to compensate for the price declines. Netting it out, even with the recent price crash and rig closures, Energy Administration numbers show that the US still produces 9.19 million barrels of Crude per day, the most since 1983.
Given current production, any upside movement in Crude prices will likely be capped. During the past 5 years, Crude witnessed a huge boom and period of over-investment, and it will take longer than 7 months to correct the imbalance. I believe that the best the industry can hope for is that price recovers to the $60 to $70 level, where production is closer to its break-even point. That said, markets rarely work logically, and are typically drawn to the levels that will inflict the greatest pain on the most people in the shortest length of time.
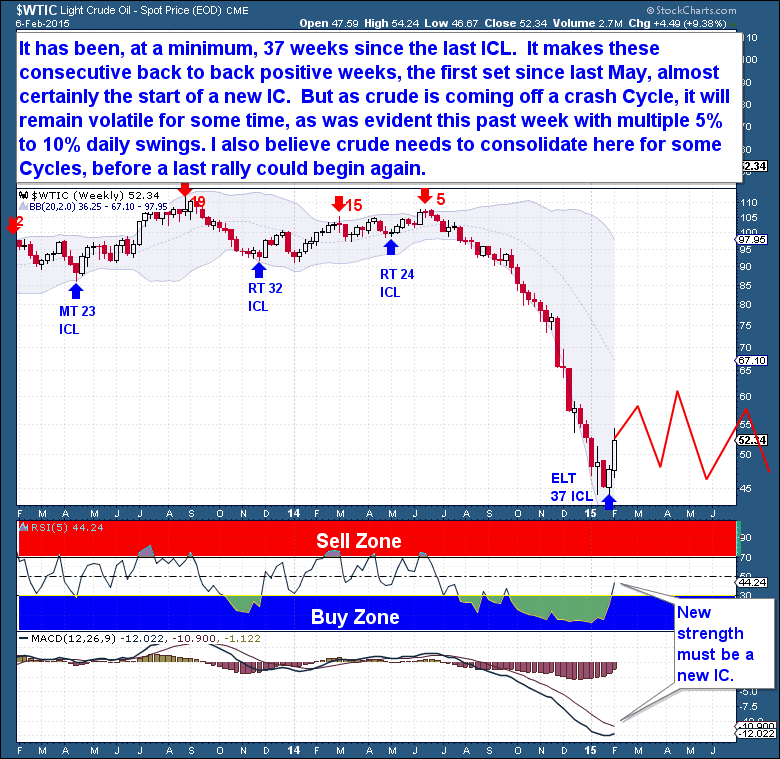
It has been a minimum of 37 weeks since the last Investor Cycle Low. This is one reason why back-to-back powerful weeks, the first such sequence since last May, signal the start of a new Investor Cycle. But with Crude coming out of a crash Cycle, price discovery will be difficult, and we should continue to see heightened volatility. To solve the over-production issue, I believe we’re going to need at least a year of depressed prices. If so, during the next 2 Investor Cycles (52 weeks), Crude prices should fluctuate between $40 and $60, with a real possibility of a drop below recent lows.
The Financial Tap publishes two member reports per week, a weekly premium report and a midweek market update report. The reports cover the movements and trading opportunities of the Gold, S&P, Oil, $USD, US Bond’s, and Natural Gas Cycles. Along with these reports, members enjoy access to two different portfolios and trade alerts. Both portfolios trade on varying time-frames (from days, weeks, to months), there is a portfolio to suit all member preferences.
TAKE ADVANTAGE OF OUR ANNUAL MEMBERSHIP SALE – ON NOW!
I rarely ever provide a “recurring” membership discount, but for one week only, all memberships are reduced by up to 35%…and not just the first billing Cycle, but for the life of your membership. The below coupons expire on Feb 17th.
Monthly Membership, normally $39.95 per month, reduced to $29.95 – SAVE 35%. PLUS, first month will cost just $10! Use Coupon Code: Big2015M
Quarterly Membership, normally $99 per quarter, reduced to $75- SAVE 35%. PLUS, first quarter reduced further, will cost just $50! Use Coupon Code: Big2015Q
Click on the offers page here, select your membership option and enter the coupon code on the checkout page. http://www.thefinancialtap.com/lp/membership/#offers
By Bob Loukas
© 2015 Copyright Bob Loukas - All Rights Reserved
Disclaimer: The above is a matter of opinion provided for general information purposes only and is not intended as investment advice. Information and analysis above are derived from sources and utilising methods believed to be reliable, but we cannot accept responsibility for any losses you may incur as a result of this analysis. Individuals should consult with their personal financial advisors.
© 2005-2022 http://www.MarketOracle.co.uk - The Market Oracle is a FREE Daily Financial Markets Analysis & Forecasting online publication.