Weekly Stock Market Technical Analysis Report - 10th Mar 07
Stock-Markets / US Stock Markets Mar 10, 2007 - 12:27 PM GMTBy: Mike_Burk
The good news is: New lows which hit 106 on the NYSE and 159 on the NASDAQ last Monday declined to 23 on the NYSE and 58 on the NASDAQ on Friday.
Short Term
New lows will reveal the short term condition of the market, but, for now, the picture is unclear.
The most encouraging data comes from the NYSE.
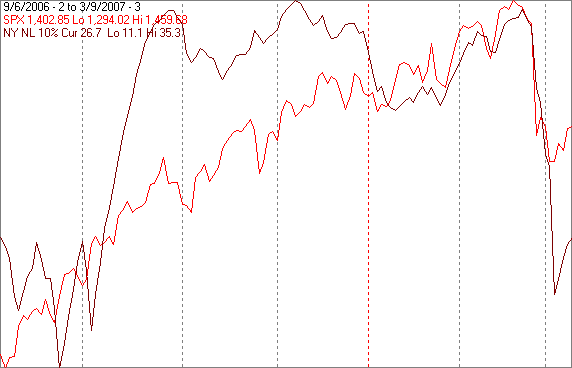
The first chart covers the past 6 months showing the S&P 500 (SPX) in red and a 10% trend of NYSE new lows (NY NL) in brown. Dashed vertical lines have been drawn on the first trading day of each month and NY NL has been plotted on an inverted Y axis to make the chart easier to read (up is good). For the past 4 days NY NL has been moving sharply upward. I have considered 5 consecutive up days on this indicator an all clear signal.
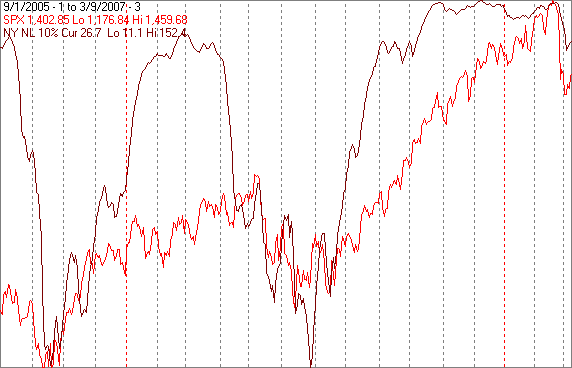
For perspective the next chart is similar to the previous one except it covers 1.5 years. NY NL recently dropped to about its high point of a year ago. NY NL had dropped substantially prior to the price high in early May. It is rare for major declines to begin without some warning from NY NL.
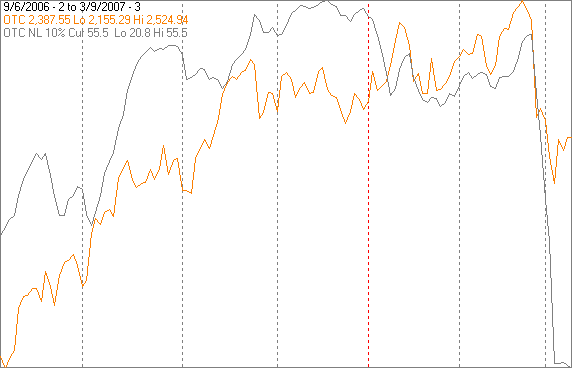
The next chart is similar to the first one except it shows the NASDAQ composite (OTC) and OTC NL calculated from NASDAQ new lows.
Usually OTC NL and NY NL move in similar patterns, but for the past few days OTC NL has continued to move downward.
A long standing rule of thumb says there is little to worry about until NYSE new lows hold above 40 for several days and NASDAQ new lows hold above 70. That rule was met between Tuesday February 27 and Monday March 5. The remainder of last week was pretty benign, but the picture is still unclear.
Intermediate term
There is usually deterioration in the breadth indicators before a major top and that was not apparent prior to the market's episode of two weeks ago.
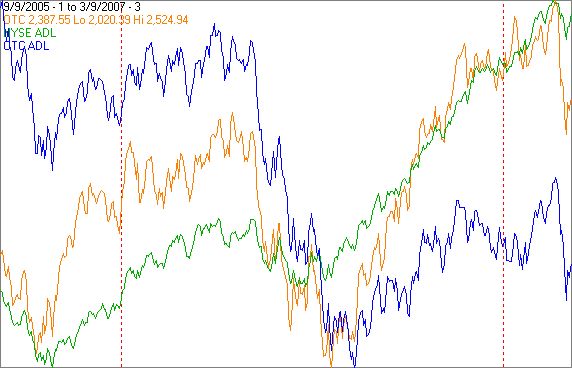
The next chart is for perspective. The chart covers 1.5 years and shows the OTC in orange, the NYSE ADL in green and the OTC ADL in blue, vertical dashed red lines have been drawn on the 1st trading day of the year. ADLs (advance - decline lines) are a running total of advancing issues - declining issues on each exchange. The chart below shows the OTC ADL has had a negative bias while the NYSE ADL has had a positive bias.
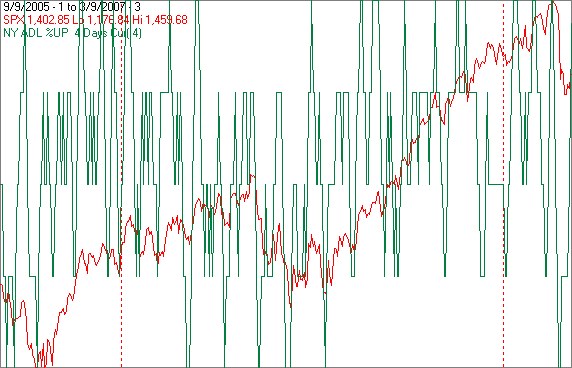
The next chart covers the same period showing the SPX in red and indicator showing the percentage of the previous 4 trading days that the NY ADL has been up. You do not need to look at this chart very closely. There are indicator holes at the bottom of the chart when the market is moving up and holes at the top of the chart when the market is approaching a top and declining. There have been no holes at the top of the chart recently.
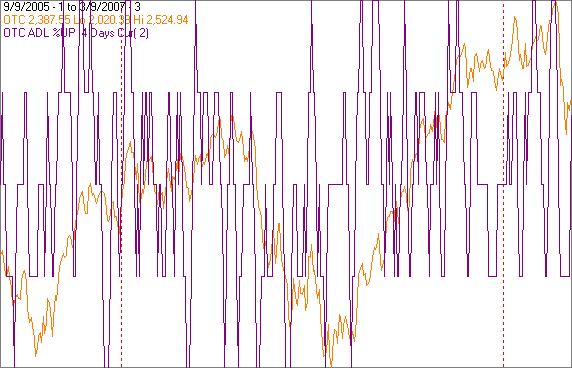
The next chart is similar to the one above except is shows the OTC in orange and the indicator shows the percentage of the previous 4 trading days of the OTC ADL that have been up. Recall the negative bias of the OTC ADL shown in the first chart of this group. The pattern in this chart is similar to the one above, but, there have not been 4 consecutive down days in the past two weeks.
It is difficult to make a case that the late February highs were a cycle top.
Seasonality
Next week includes the week prior to the 3rd. Friday of March, a triple witching options and futures expiration day and it is the week before St. Patrick's day, a major holiday for some.
The tables below show OTC data from 1963 - 2003 during the 3rd year of the Presidential Cycle and SPX data beginning with 1955.
Data prior to 1953 has been ignored because the market traded 6 days a week.
There are summaries for both the 3rd year of the Presidential Cycle and all years combined.
Next week has had a positive bias. During the 3rd year of the Presidential Cycle the OTC and SPX have both been up about 70% of the time. The averages over all years are not as good as they have been during the 3rd year of the Presidential Cycle.
Report for the week prior to the 3rd Friday of March.
The number following the year is the position in the presidential cycle.
Daily returns from Monday through 3rd Friday.
| OTC Presidential Year 3 | ||||||
| Year | Mon | Tue | Wed | Thur | Fri | Totals |
| 1963-3 | 0.19% | 0.10% | 0.10% | 0.13% | -0.26% | 0.26% |
| 1967-3 | 0.28% | -0.48% | 0.28% | 0.31% | 0.61% | 1.01% |
| 1971-3 | 0.60% | 0.41% | -0.06% | 0.36% | -0.10% | 1.21% |
| 1975-3 | 0.26% | -0.12% | -0.67% | 0.15% | 0.18% | -0.19% |
| 1979-3 | -0.05% | 0.39% | -0.08% | 0.20% | 0.55% | 1.02% |
| 1983-3 | -0.69% | -0.03% | 0.16% | -0.25% | 0.38% | -0.44% |
| Avg | 0.08% | 0.03% | -0.07% | 0.16% | 0.32% | 0.52% |
| 1987-3 | -0.26% | 0.91% | 0.09% | 0.42% | 0.60% | 1.77% |
| 1991-3 | -1.68% | -1.23% | 1.47% | -0.08% | -0.32% | -1.84% |
| 1995-3 | 0.01% | 0.74% | -0.11% | 0.24% | -0.12% | 0.76% |
| 1999-3 | 2.10% | 0.29% | -0.39% | 1.40% | -1.68% | 1.71% |
| 2003-3 | 3.88% | 0.59% | -0.25% | 0.41% | 1.36% | 5.99% |
| Avg | 0.81% | 0.26% | 0.16% | 0.48% | -0.03% | 1.68% |
| OTC summary for Presidential Year 3 1963 - 2003 | ||||||
| Avg | 0.42% | 0.14% | 0.05% | 0.30% | 0.11% | 1.02% |
| Win% | 64% | 64% | 45% | 82% | 55% | 73% |
| OTC summary for all years 1963 - 2006 | ||||||
| Avg | -0.24% | 0.00% | -0.02% | 0.21% | -0.04% | -0.08% |
| Win% | 50% | 55% | 64% | 73% | 55% | 55% |
| SPX Presidential Year 3 | ||||||
| Year | Mon | Tue | Wed | Thur | Fri | Totals |
| 1955-3 | -2.40% | 2.15% | 0.76% | 0.39% | 0.17% | 1.06% |
| 1959-3 | -1.08% | 0.82% | -0.23% | -0.09% | 0.09% | -0.49% |
| 1963-3 | 0.28% | 0.24% | 0.37% | -0.02% | 0.05% | 0.92% |
| 1967-3 | -0.52% | -0.09% | 0.95% | 1.01% | 0.18% | 1.53% |
| 1971-3 | 1.14% | 0.50% | -0.09% | 0.07% | -0.18% | 1.44% |
| 1975-3 | 1.47% | -1.02% | -0.93% | -0.87% | -0.26% | -1.61% |
| 1979-3 | 0.13% | 0.17% | -0.13% | 0.15% | 0.83% | 1.15% |
| 1983-3 | -0.27% | 0.35% | -1.03% | -0.14% | 0.21% | -0.88% |
| Avg | 0.39% | -0.02% | -0.25% | 0.04% | 0.15% | 0.33% |
| 1987-3 | -0.57% | 1.47% | 0.11% | 0.44% | 1.39% | 2.84% |
| 1991-3 | -0.53% | -0.79% | 1.23% | -0.29% | 0.02% | -0.35% |
| 1995-3 | 0.10% | 0.58% | -0.20% | 0.72% | 0.02% | 1.21% |
| 1999-3 | 0.98% | -0.07% | -0.66% | 1.45% | -1.31% | 0.39% |
| 2003-3 | 3.54% | 0.46% | 0.84% | 0.19% | 2.30% | 7.33% |
| Avg | 0.70% | 0.33% | 0.26% | 0.50% | 0.48% | 2.28% |
| SPX summary for Presidential Year 3 1955 - 2003 | ||||||
| Avg | 0.18% | 0.37% | 0.07% | 0.23% | 0.27% | 1.12% |
| Win% | 54% | 69% | 46% | 62% | 77% | 69% |
| SPX summary for all years 1953 - 2006 | ||||||
| Avg | -0.01% | 0.19% | 0.13% | 0.23% | 0.06% | 0.60% |
| Win% | 62% | 57% | 59% | 59% | 61% | 63% |
The Alpha Fund (APHAX)
The Alpha Fund, which I manage, opened last October.
Last week YTD
APHAX +0.7% +2.7%
For information about the fund go to: http://www.thealphafunds.com/index.htm . The fund now has service class shares available.
Conclusion
It is too early to tell if the drop a week ago was the beginning of something bigger. Seasonally next week has been pretty strong.
I expect the major indices to be higher on Friday March 16 than they were on Friday March 9.
Last week's positive forecast was an unambiguous miss.
By Mike Burke
Copyright © 2007 Alpha Investment Management
Mike Burk is an employee and principle of Alpha Investment Management (Alpha) a registered investment advisor. Charts and figures presented herein are believed to be reliable but we cannot attest to their accuracy. The views expressed are provided for information purposes only and should not be construed in any way as investment advice. Furthermore, the opinions expressed may change without notice. To subscribe to this report : http://alphaim.net/signup.html
© 2005-2022 http://www.MarketOracle.co.uk - The Market Oracle is a FREE Daily Financial Markets Analysis & Forecasting online publication.


