The VIX, Banks, and the Shanghai China Stocks index in Trouble
Stock-Markets / Chinese Stock Market Jun 05, 2008 - 12:43 PM GMTBy: Marty_Chenard
 This morning, we will look at the VIX (Volatility Index), the Banking Index, and the Shanghai index which is in peril of having a very sharp drop.
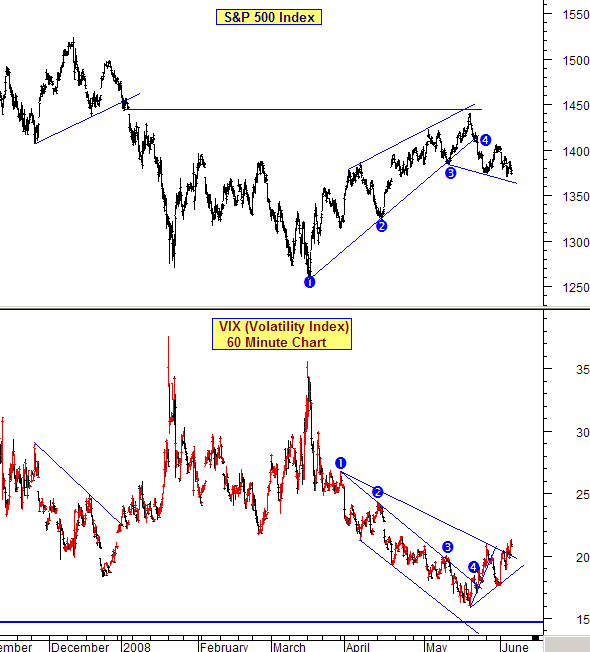
First ... let's look at the VIX vs. the S&P 500. This is its 60 minute chart going back to last September.
From March to May, the S&P went up in a slight wedge and failed to the downside on May 21st. During the current down movement, the S&P made a lower bottom and then a lower top. If it now makes another lower bottom, that would confirm a continuing, short term downside move.
At the same time, the VIX broke above its April/June resistance this week which says that fear levels are increasing. This represents a negative, divergence condition relative to the S&P and subjects the S&P to more downside. Unlike the NASDAQ 100 and the Russell 2000 (which have been holding up), the S&P 500 has been influenced by the weakness in financials. (This is because the S&P has traditionally had 20% of their stocks being financials. That has changed in recent days ... it dropped to 17.64% on January 1st. and is lower than that percentage now.)

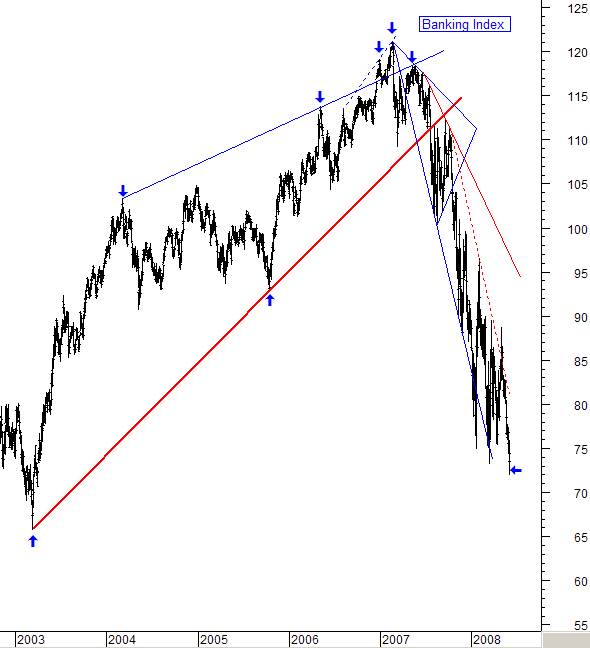
This is the chart of the Banking Index (BKX) going back to 2003.
Note the precipitous fall that has occurred. The index is still in a down trend and getting very close to making a 100% retracement of 2003's low.

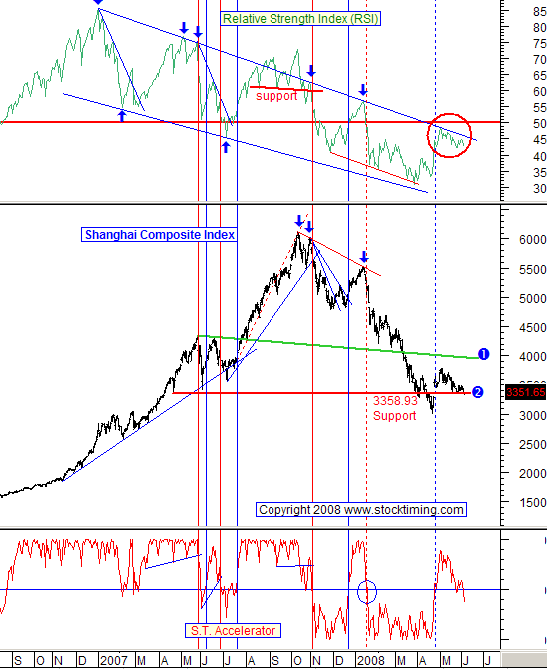
China's Shanghai has had a huge drop since last October. For some reason, the media has pretty much ignored the event and has really said little about it.
Last night, the Shanghai Composite fell below a 3358.93 critical support. It is now only 1.64% from filling a downside gap. If it does not hold there, the Shanghai will be facing a large downside risk of falling much further.

By Marty Chenard
http://www.stocktiming.com/
Please Note: We do not issue Buy or Sell timing recommendations on these Free daily update pages . I hope you understand, that in fairness, our Buy/Sell recommendations and advanced market Models are only available to our paid subscribers on a password required basis. Membership information
Marty Chenard is the Author and Teacher of two Seminar Courses on "Advanced Technical Analysis Investing", Mr. Chenard has been investing for over 30 years. In 2001 when the NASDAQ dropped 24.5%, his personal investment performance for the year was a gain of 57.428%. He is an Advanced Stock Market Technical Analyst that has developed his own proprietary analytical tools. As a result, he was out of the market two weeks before the 1987 Crash in the most recent Bear Market he faxed his Members in March 2000 telling them all to SELL. He is an advanced technical analyst and not an investment advisor, nor a securities broker.
Marty Chenard Archive |
© 2005-2022 http://www.MarketOracle.co.uk - The Market Oracle is a FREE Daily Financial Markets Analysis & Forecasting online publication.


