


U.S. Employment, the Economy & Interest Rates
Economics / US Economy Mar 10, 2015 - 05:44 PM GMTBy: Gary_Tanashian

 The February Employment report was a strong +295,000 with unemployment dropping to 5.5%. In Friday's Market Notes update we highlighted that per BLS this was a services-driven report as the leading edge of the economy, the smaller but key manufacturing and industrial sectors, have begun to decelerate (notably in forward-looking 'New Orders').
From FloatingPath.com (markups mine) we see the breakdown...
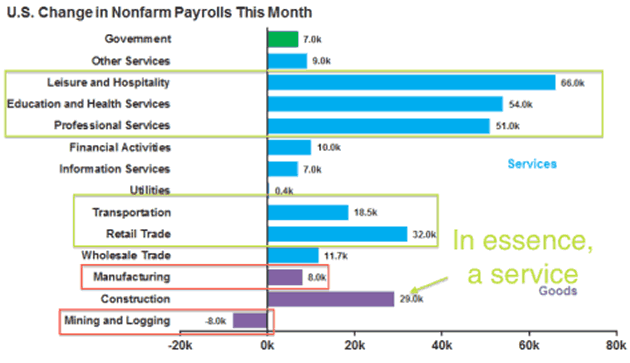
So it makes sense that 'Jobs' were strong because the large 'back end' of the US economy is responding to the years of corporate profit increases, stock market gains (wealth effect) and an overall benevolent Fed that has, every step of the way since 2008, done all it could to keep asset markets aloft (1st) and in appreciation mode (2nd). Call them Things 1 & 2, mission accomplished.
Leisure and Hospitality... America's getting out there again, living it up and feeling secure with the gains that eventually came from the post-2012 period, after we got our first little inkling two years ago in January of 2013 with the Semiconductor Equipment ramp up. I had no idea then how strong the economy would eventually become, but the massive services sectors in the US are now fully kicked in and enjoying the benefits.
As for the other segments, they are all back-end services to one degree or another including, or even especially, Construction. So there is the underwhelming Manufacturing sector and poor old Mining and Logging pulling up the rear. Here I'll remind you that the progression we used going into the economic up phase was Semi Equipment → Manufacturing/ISM → Positive Economic Signals (incl. Corp. Profits, etc.) → 'Jobs', which is where the public that uses all those services, lives.
The clock is ticking on an economic deceleration, but just as Aircraft Carriers take a long time to turnaround in one direction, so too the turn to the other.
Economy
We have also been noting that the strong US dollar would eventually begin to wear at manufacturing, industrial companies and exporters. From FactSet.com, here is some interesting data...
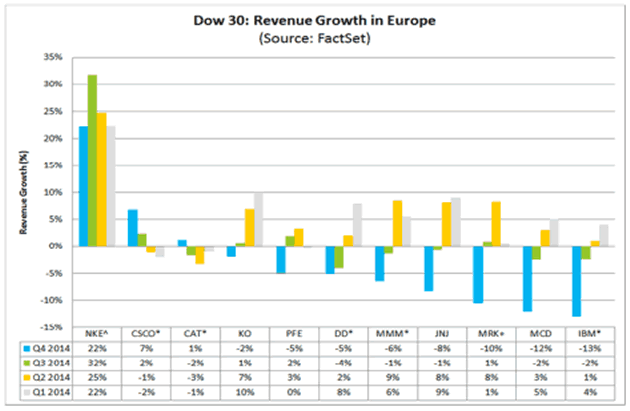
A strong currency zone exporting to an equal and opposite weak currency zone? Not a good recipe for success.
From FactSet: Overall, 11 of the 30 companies in the DJIA provided revenue growth numbers for Europe for the fourth quarter. Of these 11 companies, eight reported a year-over-year decline in revenues. This number was above the number of Dow 30 companies reporting a year-over-year sales decrease in the previous quarter (6). In fact, this was the highest number of Dow 30 companies reporting a year-over-year decline in revenue from Europe since Q4 2012 (9).
On a sequential basis, nine of the 11 companies reported a lower year-over-year sales growth rate from Europe in Q4 2014 relative to Q3 2014. Five of these nine companies have reported lower year-over-year revenue growth for three consecutive quarters.
We review the ISM data at nftrh.com each month. It has been generally and gently decelerating for a few months in a row now. This is perfectly in line with the strong dollar theme (with the caveat that it remains to be seen how much the West Coast port shutdowns have played into it).
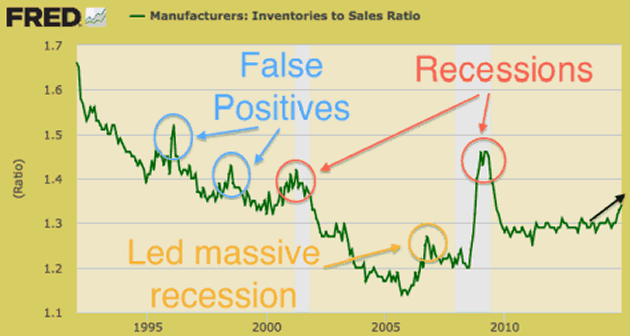
Here is a more focused view of one item that has been a key indicator on the economy. Manufacturers' inventories are starting to build relative to sales. Is this going to be another false positive or is it leading to recession? I am going to lean toward this being just an early warning, but even if that is the case 2 of the 3 false positives shown on the St. Louis Fed graph below (markups mine) eventually led to a severe recession (2001) and an utter catastrophe (2008).
The bottom line is that Inventories are rising relative to sales and that is a negative for the economy and it is right in line with the 'strong dollar' theme. A temporary positive caveat is that the vast services sectors do not carry much inventory.
Interest Rates
Here is where the mainstream media get all abuzz. The hype is everywhere amid the strong trend in Employment data. The fact is that the sum of the economy is strong and that interest rates are responding as they should. Even as far down the curve as 1 year, the Treasury market is pricing in rate hikes. As yet however, the 3 month T Bill has gone nowhere due to the Fed's ZIRP policy on Fed Funds, now well over 6 years on.
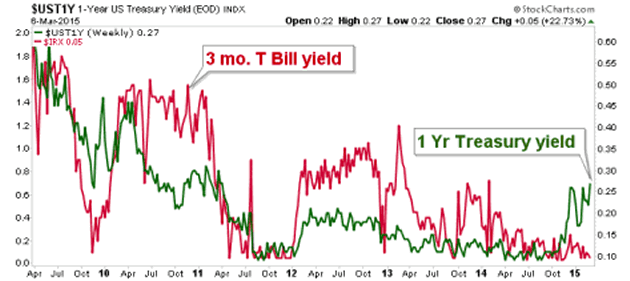
Further, the spread between 10's and 1's is portrayed as dangerous in the media, because an inverted yield curve (if it were to happen) often precedes recessions they say. Well, that is only logical because a yield inversion is the result of a boom and in an era of policy stoked financial markets, bust follows boom as surely as night follows day.
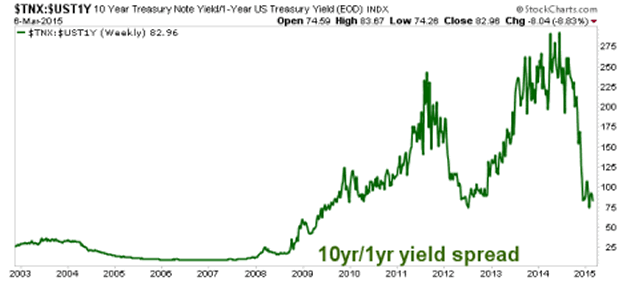
For our purposes, these declining spreads continue to imply that the economy is fine at this snapshot in time. Using yield spreads as confidence indicators as we do, the picture is one of firm confidence in policy making with no sign of an inflation problem (caveat: see TIP-TLT, page 9) or a deflationary liquidation, each of which could be indicated by a rising curve depending on whether nominal yields are rising or falling.
As 'Jobs' Friday proved, one popular measure of the economy (employment) is cooking nicely. The stock market reacted negatively, I assume because smarter money leaking out of the markets is apparently aware of the implication of this chart.
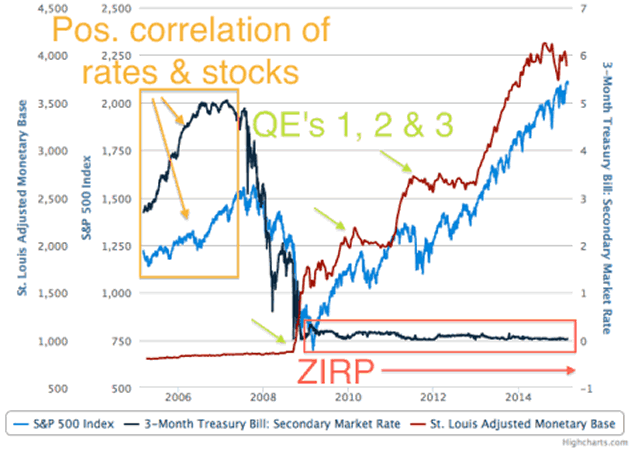
Created at SlopeCharts
On previous cycles the stock market has continued to rise to varying degrees along with the Fed Funds rate (and by extension, T-Bills). Those were relatively normal cycles with the one that topped in 2007 being instigated by Alan Greenspan's relatively normal inflationary policy and resultant credit bubble.
Again I ask you to reflect on the picture above, let it all sink in and then inform me as to how I may be wrong in the assertion that we are deep into uncharted territory regarding the amount, duration and intensity of a double barreled 6+ year helping of QE's 1-3 and ZIRP (with the odd Op/Twist and various other POMO and SOMA operations going on routinely behind the scenes).
The point I'd continue to make is that it does not make sense to automatically extrapolate or 'quant' previous cycles (ex: the stock market rises during a rate hike regime) because this cycle has been one for the policy record books. Though I don't pretend to understand their full nature, the distortions built in might also one day be recorded in the record books after they are revealed. One outcome could be that there is much less lag time (if any) between an initial rate hike and a stock market top on the current cycle.
That exercise behind us, let's move on to regular analysis... [which is exactly what #333 did in workmanlike, no frills fashion analyzing US and global stocks, precious metals, currencies and more]
Subscribe to NFTRH Premium for your 25-35 page weekly report, interim updates (including Key ETF charts) and NFTRH+ chart and trade ideas or the free eLetter for an introduction to our work. Or simply keep up to date with plenty of public content at NFTRH.com and Biiwii.com.
By Gary Tanashian
© 2015 Copyright Gary Tanashian - All Rights Reserved
Disclaimer: The above is a matter of opinion provided for general information purposes only and is not intended as investment advice. Information and analysis above are derived from sources and utilising methods believed to be reliable, but we cannot accept responsibility for any losses you may incur as a result of this analysis. Individuals should consult with their personal financial advisors.
Gary Tanashian Archive |
© 2005-2022 http://www.MarketOracle.co.uk - The Market Oracle is a FREE Daily Financial Markets Analysis & Forecasting online publication.