


The Stock Market Bull is Charging Ahead!
Stock-Markets / Stock Markets 2015 Mar 13, 2015 - 02:43 PM GMTBy: Puru_Saxena

 BIG PICTURE - After several years, the Federal Reserve has passed the QE baton to the European Central Bank (ECB) and this should extend the ongoing bull-market in common stocks. You will recall that throughout last year, we were expecting the ECB to unleash a full-scale bond buying program and Mr. Draghi's recent decision has validated our view.
If our assessment is correct, the ongoing QE initiative will assist common stocks and probably ensure the continuation of the primary uptrend until at least September 2016. At that point, if the ECB decides to extend its bond buying program, the bull-market may get another lease of life!
Over the following months, we suspect that European stocks will benefit the most from the ECB's program but equities in Japan and the US should also continue their northbound journey. In fact, even if the Federal Reserve raises its Fed Funds Rate later this year, the ongoing primary bull-market on Wall Street should not end anytime soon.
If you review Figure 1, you will note that the bellwether S&P500 Index is no longer oscillating within its lengthy trading range which commenced at the start of the millennium. Instead, it is only 2 years into a primary uptrend which (if history is any guide) should continue for several months.
Figure 1: S&P500 (monthly chart)
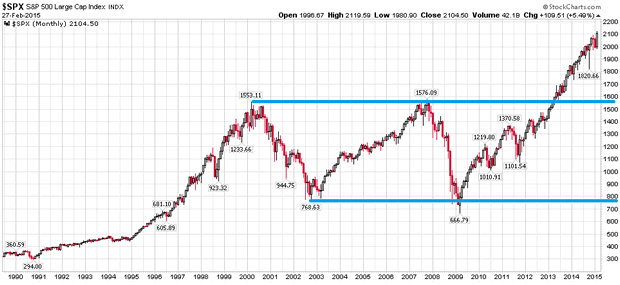
Source: www.stockcharts.com
As stated previously, we suspect that the ongoing primary uptrend will only end after the inversion of the yield curve and that is not likely to occur for another 2-3 years. Today, the yield curve remains reasonably steep and if long-term interest rates rise further, then the inversion will be pushed further into the future.
In terms of technical data, it is noteworthy that the NYSE Advance/Decline Line has climbed to a record high and this is extremely bullish for the stock market. Remember, in the past, the NYSE Advance/Decline Line (measure of breadth) has always topped out several months before the end of the bull-market so its ongoing strength is favourable for the broad stock market. Elsewhere, it is encouraging to observe that the number of 52-week highs on the NYSE is significantly greater than the number of 52-week lows and approximately 65% of the NYSE stocks are trading above the 200-day moving average. Furthermore, the Volatility Index (VIX) has declined sharply and the Russell 2000 Growth Index has recently broken out of a multi-month trading range. Last but not least, the NASDAQ Composite is trading just beneath its all-time high recorded 15 years ago and a breakout will have bullish ramifications for the broad stock market.
Looking at sectors, airlines, asset managers, auto parts/dealers, biotechnology, credit cards, consumer staples, healthcare, industrials, railways, restaurants, retail and technology stocks are outperforming the broad market. Consequently, we have allocated our equity portfolio to these industries and this strategy is performing well.
In addition to Wall Street, the bull-market is spilling over to the rest of the developed world and over the past couple of months, European stocks have performed exceptionally well! If you review Figure 2, you will observe that in response to the ECB's QE announcement, the Dow Jones STOXX 50 Index has climbed to a 7-year high and the path of least resistance appears to be up. Even though this index has appreciated a lot since March 2009, it is still way below its 2007-peak. If our analysis is on the money, then the Dow Jones STOXX 50 Index will first approach its prior peak and eventually, it will surpass that level.
Figure 2: Dow Jones STOXX 50 (monthly chart)
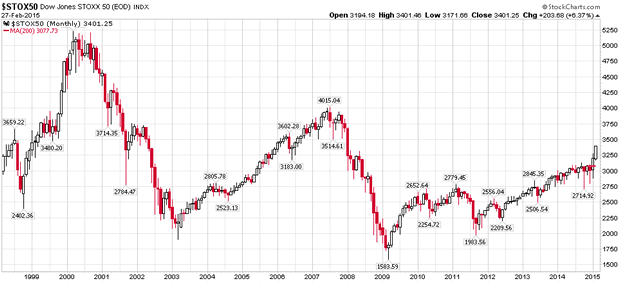
Source: www.stockcharts.com
In terms of specific stock markets within Europe, France and Germany are performing very well and both are now trading at a 7-year high. Elsewhere, the London Financial Times Index is on the verge of breaking out of a 16-year trading range and it is currently consolidating near its all-time high recorded in late 1999!
As per our expectation, the ECB's QE program is benefiting European asset prices and it is our contention that the region's economy is now on the mend. In our view, Europe's economic recovery will be sluggish but we do not believe that Greece will leave the Euro-zone. After all, European policymakers have made it very clear that Greece's exit is not an option and once the market comes to the same conclusion, we may see a resurgence of the 'risk-on' trade.
Although we remain optimistic about European assets, the single currency remains a cause for concern. Even though the Euro has depreciated significantly over the past several months, we believe that additional downside lies ahead. Accordingly, for our part, we have gained exposure to European stocks via currency hedged funds which allow us to profit from the bull-market in equities, whilst protecting us from a depreciating Euro.
Turning to Asia, it is notable that many regional stock markets are also showing strength. Most notably, after a multi-month consolidation phase, the Tokyo Nikkei Average (Nikkei) has now climbed to levels not seen since early 2000!
If you review Figure 3, you will note that the Nikkei has just surpassed its 2007 peak and is rapidly approaching its high recorded in 2000. Although anything can happen, we are of the view that once the Nikkei clears the 20,000-22,000 level, a powerful rally will unfold which will take Japanese stocks significantly higher.
Figure 3: Tokyo Nikkei Average (monthly chart)
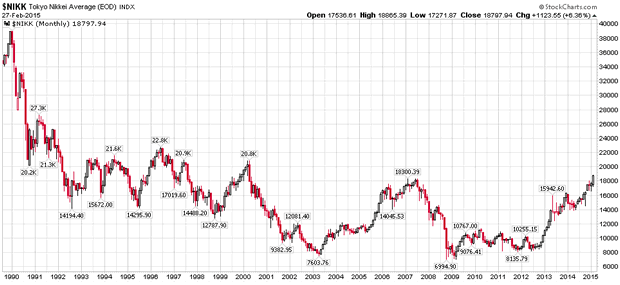
Source: www.stockcharts.com
Similar to Europe, although we remain bullish about Japanese equities, we feel that its currency will continue to depreciate over the foreseeable future. Consequently, in our fund portfolios, we have gained exposure to Japanese equities via a currency-hedged fund.
It is our contention that if the Japanese policymakers continue to 'stimulate' the economy through unconventional monetary policy, the Yen will weaken further; but this will provide a big tailwind to the major exporters. As Japanese products become cheaper, consumers all over the world will be attracted by the lower prices, thereby boosting revenues and earnings for their multi-national companies. Therefore, our readers can consider allocating to some capital to Japanese exporters.
Elsewhere in Asia, it is encouraging to note that a number of stock markets are performing well and one of our favourites (India) has recently climbed to a record high! As you will recall, we have been optimistic about Indian equities for almost a year now and despite the recent gains, we expect the primary uptrend to continue for the foreseeable future.
In addition to India, the Philippines Composite Index, Taiwan Weighted Index and Thailand's SET Index are showing ongoing strength. Elsewhere, Hong Kong's Hang Seng Index, Singapore's Straits Times Index and South Korea's Seoul Composite are still consolidating within a trading range but the path of least resistance seems to be up.
Over the following months, the majority of the Asian stock markets are likely to appreciate in value but they may still underperform relative to the stock markets of the developed world. Consequently, our readers may want to limit their exposure to Asian stocks.
Last but not least, as far as China's stock market is concerned, we maintain our position that the Shanghai Composite Index is in the early stages of a primary uptrend which will probably continue for several months.
If you review Figure 4, you will note that after the blistering rally since last summer, the Shanghai Composite is now consolidating near the high recorded in 2009. However, after some additional sideways grinding, it is likely to embark on a powerful, multi-month rally.
Figure 4: Shanghai Composite Index (weekly chart)
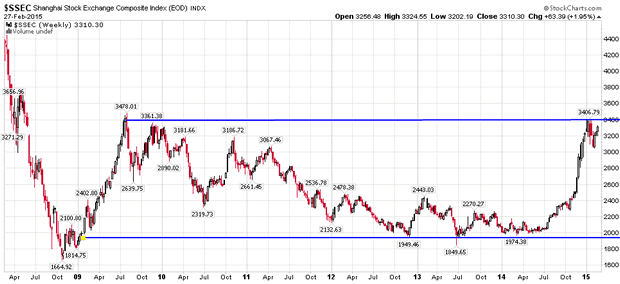
Source: www.stockcharts.com
From a fundamental perspective, it is encouraging to note that the Chinese authorities have recently eased monetary policy and this should be a big tailwind for equities. Bearing in mind the favourable technical and fundamental backdrop, we are maintaining our exposure to Chinese A-Shares and believe that these holdings will reward us over the following months.
Even though a number of stock markets are performing well, on the bearish side of the equation, it is worth mentioning that commodity-exporting nations such as Brazil and Russia remain out of favour amongst investors and they should be avoided for now.
In summary, the monetary backdrop remains supportive of the stock market and during the course of this bull-market; the developed world is likely to outperform the developing world. Consequently, we have over-weighted our managed portfolios to Japan, Europe and the US.
In addition to the developed world, the stock markets of China and India are also likely to perform well, so we recommend exposure to these fast growing economies.
If our assessment is even vaguely correct, the ongoing primary uptrend in common stocks will probably continue for at least another 2 years and the inversion of the US yield curve will assassinate this bull-market and bring about the next recession. Fortunately, the inversion of the yield curve and the next recession seem to be at least several months away.
Puru Saxena publishes Money Matters, a monthly economic report, which highlights extraordinary investment opportunities in all major markets. In addition to the monthly report, subscribers also receive “Weekly Updates” covering the recent market action. Money Matters is available by subscription from www.purusaxena.com.
Puru Saxena
Website – www.purusaxena.com
Puru Saxena is the founder of Puru Saxena Wealth Management, his Hong Kong based firm which manages investment portfolios for individuals and corporate clients. He is a highly showcased investment manager and a regular guest on CNN, BBC World, CNBC, Bloomberg, NDTV and various radio programs.
Copyright © 2005-2014 Puru Saxena Limited. All rights reserved.
Disclaimer: The above is a matter of opinion provided for general information purposes only and is not intended as investment advice. Information and analysis above are derived from sources and utilising methods believed to be reliable, but we cannot accept responsibility for any losses you may incur as a result of this analysis. Individuals should consult with their personal financial advisors.© 2005-2022 http://www.MarketOracle.co.uk - The Market Oracle is a FREE Daily Financial Markets Analysis & Forecasting online publication.