


US Stock Market Waiting on the USD
Stock-Markets / Stock Markets 2015 Mar 15, 2015 - 08:05 AM GMTBy: Tony_Caldaro

 The week started off at SPX 2071 and rallied to 2083 on Monday. Then a Tuesday gap down opening carried the SPX to 2040 by Wednesday. Thursday’s gap up opening and rally to SPX 2066, was nearly completely reversed on Friday’s gap down opening. A choppy week. For the week the SPX/DOW lost 0.75%, the NDX/NAZ lost 1.40%, and the DJ World index lost 1.40%. On the economic front reports came in mixed. On the uptick: wholesale inventories, export prices, the WLEI, plus weekly jobless claims and the treasury deficit improved. On the downtick: retail sales, the PPI, import prices, consumer sentiment, and the MMIS. Next week is the FOMC meeting, plus Industrial production, reports on Housing, and Options expiration.
LONG TERM: bull market
The bull market had its sixth year anniversary this week, the third longest in US history. While it has risen from SPX 667 to 2120, we have been labeling the advance as a Cycle wave [1] of a new Super cycle 3 multi-generational bull market. This Cycle wave is unfolding in five Primary waves. Primary waves I and II completed in 2011, and Primary wave III has been underway since then. When it concludes, which we expect to be in 2016, there will be a steep Primary IV correction, and then a Primary V to new highs in 2017.
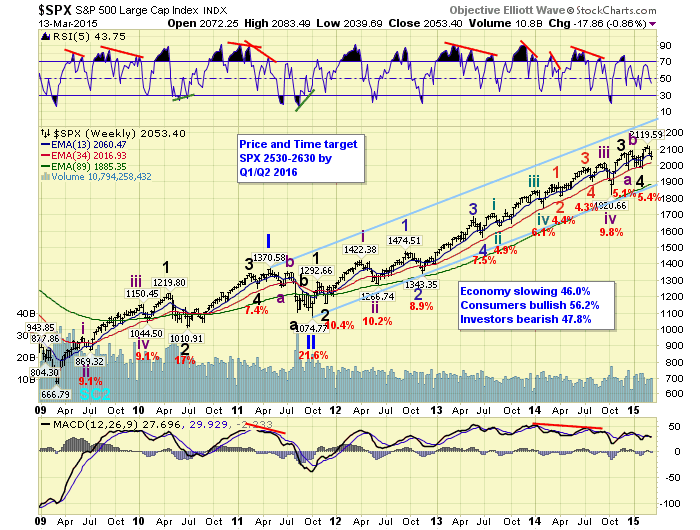
On January 24th 2015 the ECB officially announced EQE: 60bn Euros per month until at least September 2016. Quantitative easing programs, as most know, have been quite positive for equity markets worldwide since 2009. The EQE program actually started this week. At the time of the announcement the DAX had closed at 10,436. It has risen 14% since then, as of Friday’s close. In the US, however, something else has transpired.
Since the ECB EQE announcement the SPX has completed a downtrend at 1981, started a new uptrend to 2120, and has now pulled back to 2040 this week. At the time of the announcement the SPX had closed at 2063. So the US is oddly down about 1/2% during the same period. What has benefitted from the EQE announcement, and a potential rate hike in June, is the USD. It has risen 6% since January 24th.
In February individual investors reported a 9% portfolio reallocation out of equities into bonds and cash. This is the largest one month decline, since a 7% stock reallocation in August 2011. And, that was during a Primary II selloff. In addition, earnings forecasts for Q1 have declined from flat to -4+% in the past several weeks. Probably due to the weather and the rising USD. All in all, it appears investors have turned defensive with earnings expected to decline and a rising USD, which is expected to get stronger if the FED does increase rates in Q2. Normally, when people get bearish/defensive in a bull market it begins to recover and start rising again.
MEDIUM TERM: uptrend
After the SPX hit 2079 in early December, it corrected 1973, advanced to 2094, then corrected to 1981 by early February. We counted that entire correction as an irregular Major wave 4 flat. After that low the SPX advanced, in five waves, to a new high at 2120 by late-February. Then for the past two weeks the market has been in pullback mode.
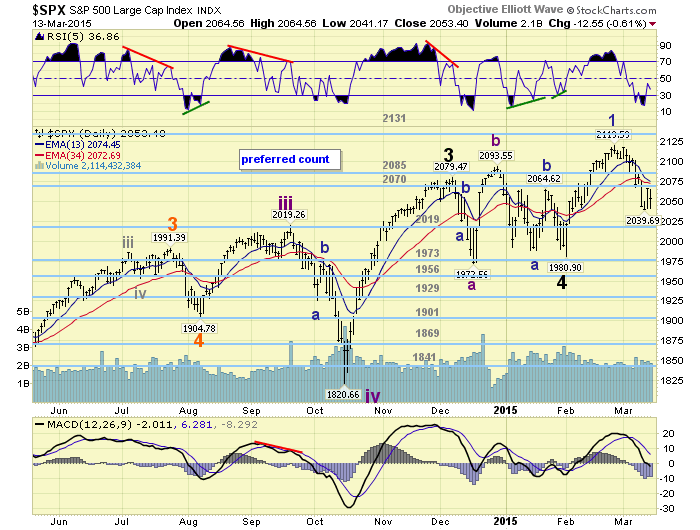
During the five wave advance (2072-2042-2102-2085-2120) the fifth wave was the weakest wave, so we expected wave pattern support between SPX 2042 and 2072. The low so far is SPX 2040. Currently the market has retraced between 50% and 61.8% of the uptrend. We had calculated a 50% retracement at SPX 2051, and 61.8% at 2034. Thus far the pullback has fit within the parameters of what was expected. Yet it has been quite a complex pattern with 5 larger waves, and 13 smaller waves. Possibly the next push lower could end it. Medium term support is at the 2019 and 1973 pivots, with resistance at the 2070 and 2085 pivots.
SHORT TERM
On Thursday we observed a 2.0 relationship between the first decline Minute a (2120-2088) and the second decline Minute c (2104-2040). This appeared to be enough for a potential low, and we labeled the SPX hourly chart with a tentative Minor wave 2. On Friday, however, Thursday’s rally was nearly fully retraced leaving the option open for a continuation of the pullback. Should it continue lower the 61.8% retracement level at SPX 2034 would be next, followed by a 2.618 relationship between Minute waves c and a at 2020.
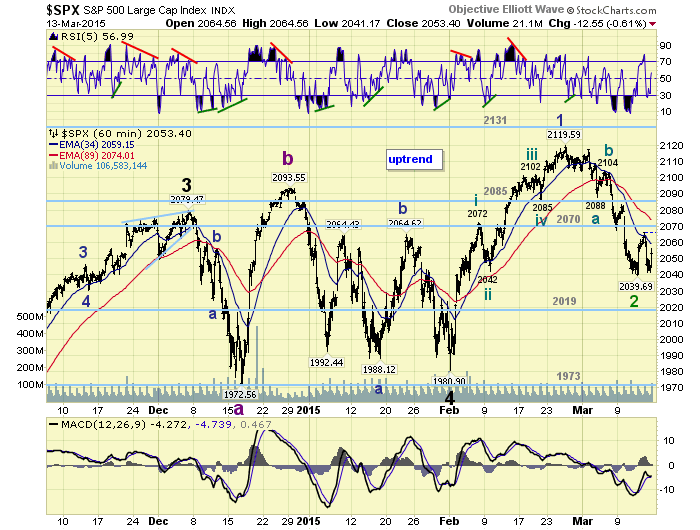
Short term support is at SPX 2051 and SPX 2034, with resistance at the 2070 and 2085 pivots. Short term momentum ended the week around neutral. Suggest keeping an eye on the USD. Its ten month uptrend appears to have kept this market within a SPX 2000 to 2100 range for months. Any correction in the USD would probably lead to an extension of the current uptrend. Best to your trading!
FOREIGN MARKETS
The Asian markets were mostly lower losing 0.7% on the week.
The European markets were mixed but also lost 0.7%.
The Commodity equity group were all lower losing 4.0%.
The DJ World index lost 1.40%.
COMMODITIES
Bonds continue to downtrend but gained 0.3% on the week.
Crude lost 9.9% on the week as its downtrend continues.
Gold lost 1.4% on the week as it continues to downtrend.
The USD rallied 1.8% on the as its uptrend continues to extend.
NEXT WEEK
Monday: the NY FED at 8:30, Industrial production (est. +0.15%) at 9:15, and the NAHB at 10am. Tuesday: Building permits and Housing starts. Wednesday: the FOMC meeting concludes. Thursday: weekly Jobless claims, the Philly FED, Leading indicators and Senate testimony from FED governor Tarullo. Friday: Options expiration. Best to your weekend and week!
CHARTS: http://stockcharts.com/public/1269446/tenpp
http://caldaroew.spaces.live.com
After about 40 years of investing in the markets one learns that the markets are constantly changing, not only in price, but in what drives the markets. In the 1960s, the Nifty Fifty were the leaders of the stock market. In the 1970s, stock selection using Technical Analysis was important, as the market stayed with a trading range for the entire decade. In the 1980s, the market finally broke out of it doldrums, as the DOW broke through 1100 in 1982, and launched the greatest bull market on record.
Sharing is an important aspect of a life. Over 100 people have joined our group, from all walks of life, covering twenty three countries across the globe. It's been the most fun I have ever had in the market. Sharing uncommon knowledge, with investors. In hope of aiding them in finding their financial independence.
Copyright © 2015 Tony Caldaro - All Rights Reserved Disclaimer: The above is a matter of opinion provided for general information purposes only and is not intended as investment advice. Information and analysis above are derived from sources and utilising methods believed to be reliable, but we cannot accept responsibility for any losses you may incur as a result of this analysis. Individuals should consult with their personal financial advisors.
Tony Caldaro Archive |
© 2005-2022 http://www.MarketOracle.co.uk - The Market Oracle is a FREE Daily Financial Markets Analysis & Forecasting online publication.