


Sharp Fall In USD Index And Its Implications
Currencies / US Dollar Mar 20, 2015 - 08:42 AM GMTBy: Nadia_Simmons

 Yesterday, Ms. Yellen said that the Federal Reserve will likely raise interest rates later this year, but it will not occur after the FOMC next meeting in April. She also added that the decision will depend on the data. In response to this announcement the USD Index reversed and dropped below the barrier of 100, accelerating further declines. As a result, the greenback hit an intraday low of 94.77 against the basket of major currencies. What impact did this correction have on their short-term picture?
In our opinion, the following forex trading positions are justified - summary:
EUR/USD: none
GBP/USD: none
USD/JPY: none
USD/CAD: short (stop loss order at 1.2876)
USD/CHF: none
AUD/USD: none
EUR/USD
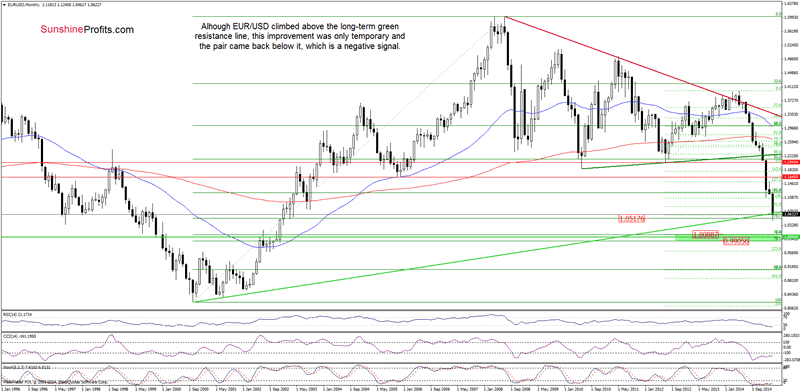
Looking at the weekly chart, we see that although EUR/USD moved higher and climbed above the long-term green line, this improvement was only temporary and the exchange rate came back below this key resistance line. This is a negative signal, which suggests another attempt to move lower.
Will we see such price action? Let's examine the daily chart and look for more clues about future moves.
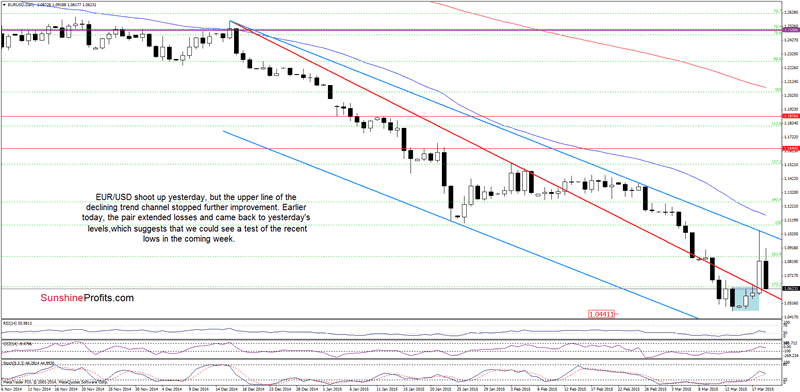
From this perspective, we see that EUR/USD shoot up yesterday, breaking above the upper line of the consolidation and the medium-term red resistance line. With this upswing, the pair reached the upper line of the declining trend channel, which stopped further improvement. Earlier today the exchange rate extended losses and came back to yesterday's levels, slipping to the previously-broken declining support/resistance red line. In our opinion, if this line withstands the selling pressure, we'll likely see a rebound from here and another attempt to break above the upper border of the trend channel. However, taking into account the medium-term picture we should also consider a bearish scenario. In this case, if these levels are broken, EUR/USD will test the recent lows in the coming days. Therefore, we think that it's worth to wait for today's session close because it will give us more clues about future moves. If the pair closes the day above the red line, currency bulls will try to realize a pro-growth scenario. Otherwise, lower values of the exchange rate will be in play.
Very short-term outlook: mixed
Short-term outlook: mixed
MT outlook: mixed
LT outlook: mixed
Trading position (short-term; our opinion): No positions are justified from the risk/reward perspective at the moment.
USD/JPY
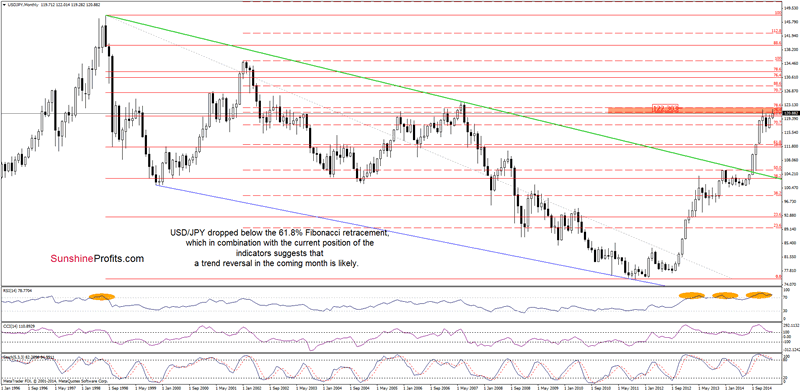
On the above chart, we see that USD/JPY dropped below the 61.8% Fibonacci retracement level (based on the entire 1998-2011 declines), which in combination with the current position f the indicators suggests that a trend reversal in March is likely.
Having said that, let's examine the daily chart.
On Tuesday, we wrote the following:
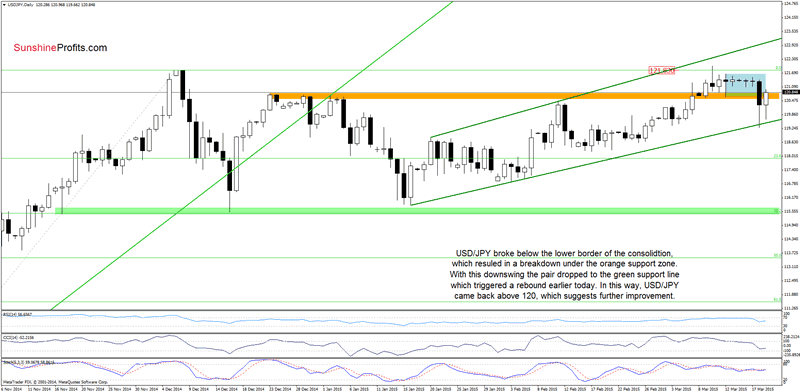
(...) we should keep in mind that sell signals generated by the indictors support the bearish case, suggesting that another test of the strength of the orange support zone is more likely than not.
Looking at the above chart, we see that currency bears not only managed to break below the lower border of the consolidation (marked with blue), but also took the exchange rate under the previously-broken orange support zone. With this upswing, the pair declined to the green line based on the Jan 16, Feb 2 and Feb 6 lows. As you see on the chart, this support withstood the selling pressure, which triggered a rebound earlier today. In this way, USD/JPY came back above 120, which suggests further improvement and a test of the upper border of the consolidation in the coming days.
Very short-term outlook: mixed
Short-term outlook: mixed
MT outlook: mixed
LT outlook: bullish
Trading position (short-term; our opinion): No positions are justified from the risk/reward perspective at the moment.
AUD/USD
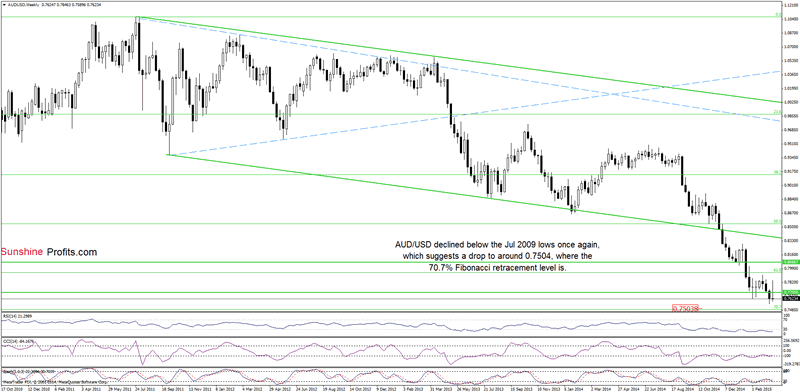
The situation in the medium term has deteriorated slightly as AUD/USD declined below the Jul 2009 lows once again. If the pair moves lower we could see a drop even to 0.7504, where the 70.7% Fibonacci retracement is.
Having said that, let's focus on the very short-term changes.
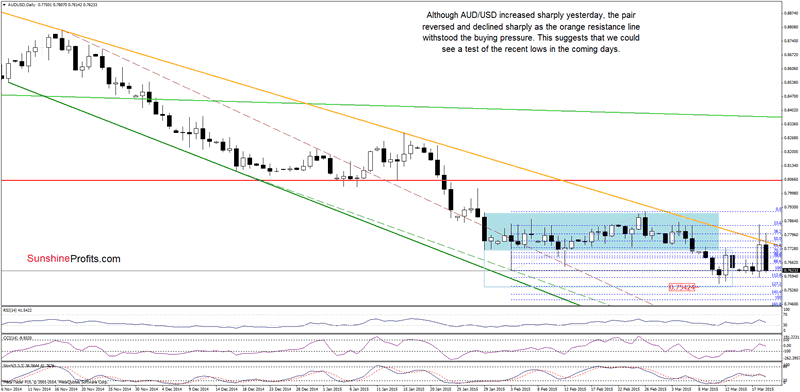
Although AUD/USD increased sharply yesterday, the pair reversed and declined as the orange resistance line withstood the buying pressure. Earlier today, we saw another attempt to break above this major resistance line, but currency buls failed, which triggered a sharp decline to the levels that we saw at the beginning of the week. This suggests that we could see a test of the recent lows in the coming days. At this point it's worth noting that if the exchange rate breaks below it, the initial downside target for currency bears would be around 0.7542, where the 127.2% Fibonacci extension is.
Very short-term outlook: mixed with bearish bias
Short-term outlook: mixed
MT outlook: mixed
LT outlook: mixed
Trading position (short-term; our opinion): No positions are justified from the risk/reward perspective at the moment.
Thank you.
Nadia Simmons
Sunshine Profits‘ Contributing Author
Oil Investment Updates
Oil Trading Alerts
* * * * *
Disclaimer
All essays, research and information found above represent analyses and opinions of Nadia Simmons and Sunshine Profits' associates only. As such, it may prove wrong and be a subject to change without notice. Opinions and analyses were based on data available to authors of respective essays at the time of writing. Although the information provided above is based on careful research and sources that are believed to be accurate, Nadia Simmons and his associates do not guarantee the accuracy or thoroughness of the data or information reported. The opinions published above are neither an offer nor a recommendation to purchase or sell any securities. Nadia Simmons is not a Registered Securities Advisor. By reading Nadia Simmons’ reports you fully agree that he will not be held responsible or liable for any decisions you make regarding any information provided in these reports. Investing, trading and speculation in any financial markets may involve high risk of loss. Nadia Simmons, Sunshine Profits' employees and affiliates as well as members of their families may have a short or long position in any securities, including those mentioned in any of the reports or essays, and may make additional purchases and/or sales of those securities without notice.
© 2005-2022 http://www.MarketOracle.co.uk - The Market Oracle is a FREE Daily Financial Markets Analysis & Forecasting online publication.