Stock & Commodity Markets Elliott Wave Analysis - 11th March 07 - The Magic Number
Stock-Markets / Elliott Wave Theory Mar 11, 2007 - 03:03 PM GMTBy: Dominick
I'm sure there were readers who couldn't understand the bullish tone from last week's update after the S&P closed on the lows that Friday and looked as if it was about to fall off a cliff. There was plenty of talk last weekend of a “running flat” second wave.
Such a pattern is when the underlying trend is so strong that it overwhelms the correction and, in a decline, wave c is unable to exceed the peak of wave a. Monday's gap down should have ensured the doubters that this was in fact the correct pattern and that the trap door had been opened for the third of a third … again .
Since the Forums run 24/7, I posted this chart on Sunday night which clearly shows where I thought support was about to show up.

Creating the chart was easy as it was part of the plan from the previous week. Readers should remember that last week's update stated:
I'm sure many bearish traders are now feeling comfortable, but should they? The quickness of this selloff could actually open the door to other ideas later. A more grinding selloff that eventually ended in the way this one started would have been better accepted. Either way, we will be sure to be on top of it. Unless certain levels break, or bullish sentiment comes roaring in, we will be looking to scoop up a bargain very early this week. We hope to get a continuation of Friday's selloff as we have a number to buy that could mark some type of s/t low, otherwise we are prepared to pay up.
The level that was held for members only was 1377 and Monday's opening low was 1376.50! Not only that, but if you recall the February 18 th update, I stated that I wasn't comfortable with all the March turn dates. We avoided all the market's traps as it topped days after that update. I also mentioned that my timeframe for a turn was March 6 th to 8 th . Having that turn date appear at this week's low was an added plus.
But that was only the beginning because all the levels mentioned in the forum Monday came in very nicely. With 1377 confirmed as the low, the plan became to take profit at 1385 and then, if the pullback from 85 held, stick around for a run up to 1394. The pullback did hold and the high of the day was 1393.75! Maybe it's hard to believe reaching such perfect targets is possible, but the proof is in the post, which appeared in the forum at 9:55 Monday morning.
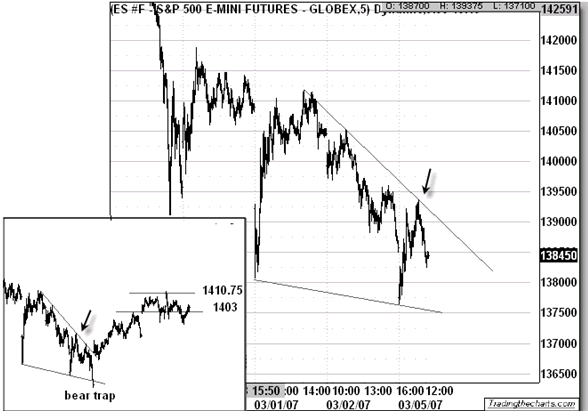
Even though the low looked to be in at that point, and that all we'd been getting was the healthy pullback, the chart gave us reason to stay alert for a possible selloff into the close. Using “unbiased” Elliott, this chart was posted at 12:18 along with the idea that this ending diagonal needed an additional low before ending the move from February 22. We also knew that the end of that diagonal could get a gap up, trapping late bears. The smaller chart below shows the bear trap and the next morning's gap along with projections discussed later.

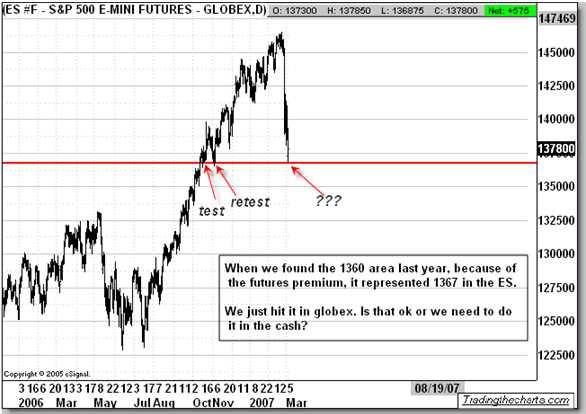
Monday's close at 1372.50 put my good old 1360 target on the radar. Still, knowing that our domestic markets don't do anything the easy way, I was uncomfortable thinking many others now had the same target. Scanning through the charts, I realized that the S&P futures were at 1367 when we reached 1360 in the cash index last year. Watching the market create another small wave down into 1368.75 that night, and then try to rally, made me very suspicious. It wasn't so much the additional 2 points, but that, because of the larger premium we have in the futures these days, it seemed we were hitting the magic number in globex. This chart was posted showing what I had found:

Monday's globex low was a mere 1 ½ points above the target in the futures and with that, everyone at TTC knew we were looking at the possibility of registering the low for the week. I'm sure it wasn't easy taking a long position at those globex lows, but it must have been far more scary for shorts that woke up to a huge gap in the charts. Thirteen points just because the overseas markets were firming up, I think not!
Once that gap held, we focused on the previous levels and added 1403 and 1410.75 in the March futures. Not only was Friday's gap high 1411.25, but the futures seemed to “vibrate” around the 1403 area for the last 2 days.
What's next?
As stated last week, I'm watching the huge swings the market is giving us and looking to put together the big picture in a week or two. But I still believe that, with what the market has given us up to this point, all anyone can do is guess at what comes next for the intermediate term. That's not going to keep lots of analysts from doing it anyway, but it's exactly how bias starts.
So, bears will be looking at this week's rally as a wave 2 that leads to a melt down next week. Bulls see the recent lows as THE lows, which might have some merit, but, even if the bulls are correct, there are valid ways of frustrating both sides as we consolidate and rebuild the trend before once again advancing. Plans for that scenario are already in place and reserved for members. I also think the boxing gloves might come off and we'll be in for a real streetfight at the first gap off the lows, if we try and retest them.
I mentioned last week that the violent drop was not what I wanted to see and that it opened the door to other ideas beyond the traditional bear market that looked likely as we zoned in on and perfectly played the February highs. It's trendy right now to predict a massive selloff, but Cliff Droke, in his most recent update , has a unique and profound take on the current market sentiment and I couldn't agree more. He says:
“The main market psychology indicators are flashing major buy signals right now. Last week's panic sell-off was an event that won't soon be forgotten from Wall Street's collective minds. Judging by the market psychology indicators it has already had a profound impact on investor sentiment that is helping to cushion the market as a bottoming process begins. If history is any guide this will prove to be a major bottom and should be followed by a worthwhile advance in stock prices.”
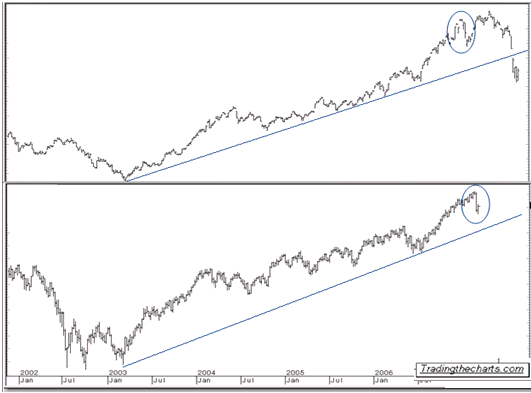
Once again, markets like this are for trading, not predicting. Some think the highs are locked in, others think the lows are in. I can't entirely advocate all the trading ideas and targets in Droke's article, but when you examine the recent lows and look back at history, this next chart from last week in the forums shows that it's still possible to see new highs AND new lows from here. Did the magic number 1360 put in a bottom in the futures market or does the cash market need to be tested and decide? We'll be monitoring this possibility in realtime as we watch developments in certain key levels and/or shifts in sentiment that would give us a reason to rule it out. Basically, this is time for our “unbiased” Elliott wave methods to shine

It's unfortunate, but the only thing that's certain right now is that traders who are only focused on hearing a count and guessing whether THE top is in will miss huge moves that we'll continue to ride each and every day. Now more than ever, the only safe way to attack this market is in realtime.
Check out the rest of the weekend charts already posted in the forums and then trade along intraday, all still for $50 a month. You won't get emails to buy here or sell, but instead you'll learn how to make the entry and exit areas yourself as you see the market structure unfold. Join us to learn how to trade the markets consistently and profitably. If in a week you don't like it, send me an email and I'll refund your full fee, no questions asked! (Must join before March 16, 2007 )
Metals
Be sure to read this week's Precious Points for the latest on the volatile metals markets.
Have a profitable, and safe week trading, and don't forget:
“Unbiased Elliott Wave works!”
By Dominick
For real-time analysis, become a member for only $50
If you've enjoyed this article, signup for Market Updates , our monthly newsletter, and, for more immediate analysis and market reaction, view my work and the charts exchanged between our seasoned traders in TradingtheCharts forum . Continued success has inspired expansion of the “open access to non subscribers” forums, and our Market Advisory members and I have agreed to post our work in these forums periodically. Explore services from Wall Street's best, including Jim Curry, Tim Ords, Glen Neely, Richard Rhodes, Andre Gratian, Bob Carver, Eric Hadik, Chartsedge, Elliott today, Stock Barometer, Harry Boxer, Mike Paulenoff and others. Try them all, subscribe to the ones that suit your style, and accelerate your trading profits! These forums are on the top of the homepage at Trading the Charts. Market analysts are always welcome to contribute to the Forum or newsletter. Email me @ Dominick@tradingthecharts.com if you have any interest.
This update is provided as general information and is not an investment recommendation. TTC accepts no liability whatsoever for any losses resulting from action taken based on the contents of its charts, commentaries, or price data. Securities and commodities markets involve inherent risk and not all positions are suitable for each individual. Check with your licensed financial advisor or broker prior to taking any action.
© 2005-2022 http://www.MarketOracle.co.uk - The Market Oracle is a FREE Daily Financial Markets Analysis & Forecasting online publication.


