


Stock Market Sixth Sense
Stock-Markets / Stock Markets 2015 Apr 14, 2015 - 10:22 AM GMTBy: Austin_Galt

 The argument between fundamental and technical analysis is an old one and is unlikely to be resolved any time soon. I generally find those that bash technical analysis just don't understand the whole concept of it. Many snub their noses at it, perhaps dismissing it because they don't understand it. Perhaps they are too brainwashed or lazy to even bother trying to understand. That's fine.
Some ask sneeringly, how does technical analysis predict a black swan event? It doesn't. Neither does fundamental analysis. However, the advantage of technical analysis over fundamental analysis is that it provides clues that something may be about to happen.
It is common knowledge that animals have a sixth sense and this is the reason given for the animals reportedly running up the mountain just before the tsunami hit on Christmas Day 2004. We don't have the knowledge to explain this but we know it happened.
Well, I believe the markets also possess a sixth sense and clues are given before serious events hit. Baloney, some may say! Now I can't prove this and while my mind is open I still look for evidence.
So, what I will do now is provide evidence of two major black swan events in which technical analysis was able to guide us to being on the right side of the market before the event. The first is the Fukushima tsunami in 2011 and the second is the September 11 attacks in 2001.
The Fukushima nuclear disaster was created by an earthquake on the 11th March 2011 that caused a tsunami. This tsunami caused a substantial amount of radioactive material to be released from the Fukushima 1 Nuclear Power Plant on March 12th which was a Saturday.
Let's look at a daily chart of Global X Uranium ETF (URA), which is a uranium shares ETF, over that time period.
URA Daily Chart
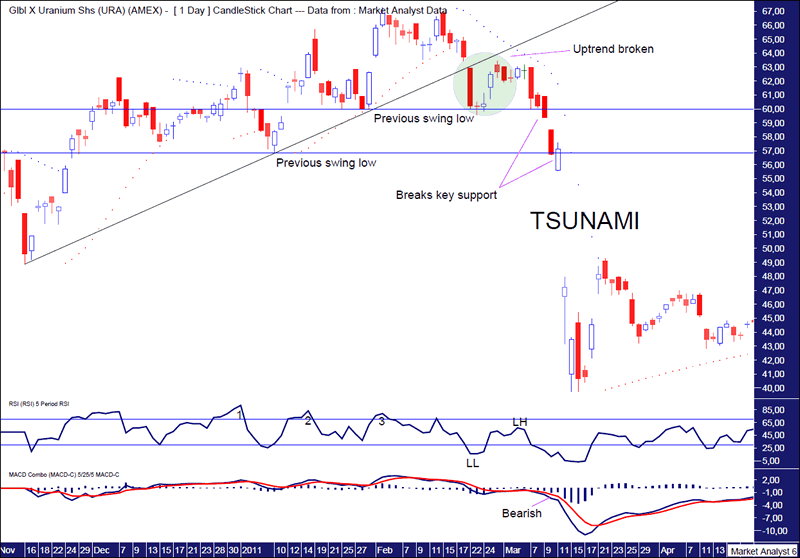
I have drawn an uptrend line connecting previous swing lows and in the green highlighted circle we can see where price made the first break down of this support line. Price then confirmed this initial break down by going on to bust previous swing low support levels which are denoted by the horizontal lines. We can see price clearly breached the lower horizontal line on the 10th and 11th March.
The Relative Strength Indicator (RSI) even showed a triple bearish divergence denoted by the numbers 1, 2 and 3 which often leads to a significant decline. A pattern of lower lows and lower highs was also in place before disaster struck.
The Moving Average Convergence Divergence (MACD) indicator was also clearly trending down with a bearish bias before the earthquake hit.
The Parabolic Stop and Reverse (PSAR) indicator busted the dots on the downside on the third day after the top and maintained a bearish bias throughout.
With images of the disaster plastered on TV screens over the weekend of the 12th and 13th March and the magnitude of the event sinking in, it was no surprise to see uranium stocks gap down on the open the following Monday 14th March 2011.
Now this is all easy to see in hindsight but I was on the front line when this happened so I can speak personally about it. I was bullish uranium in the lead up to this event and held several uranium stocks. It was only after the aforementioned break down of support that I started to get the heebie-jeebies. The final straw for me was on Thursday 10th March which saw prices break the second previous swing low level. While I remained fundamentally bullish uranium as that is what most fundamental analysis suggested, it was the technicals that forced my hand and I dumped half of all my uranium stocks on that Thursday. Over the weekend I wished I had dumped the lot. Thanks for nothing fundamentals! I dumped the other half on the Monday after the gap down as the fundamentals were surely shot by then!!
Now clearly the technicals did not predict an earthquake or tsunami. Anyone that says that just doesn't get it and perhaps never will. The technicals just suggested something was not right and it didn't take long to find out why.
Let's now look at the daily chart of the Dow in the lead up to the September 11 attacks in 2011.
DOW Daily Chart
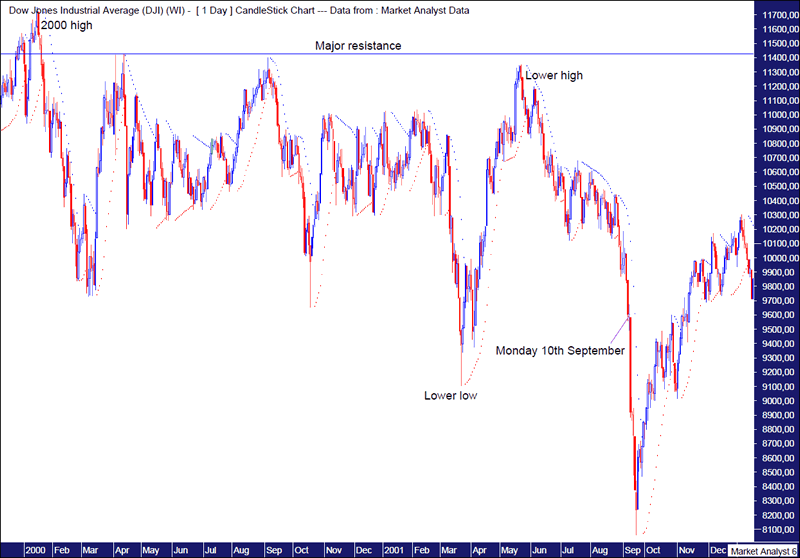
We can see the trading after the 2000 high was generally sideways to down with a pattern of lower lows and lower highs. I have drawn a horizontal line which denoted major resistance which price was just not able to overcome.
Price effectively made a bearish triple top with the trend as there were three tops at this resistance level which was below the previous swing high being the 2000 top. This alone was a clear sign that a move down was the probability play.
The PSAR indicator already had a bearish bias with the dots above price well before the attacks.
Price had already moved sharply down into the week of the attacks. The candle on Monday 10th September was a little doji after a solid move down the previous Friday 7th September. This doji often indicates indecision and it certainly would have been a bold move buying into that falling knife move.
It would not have been the end of the world anyway if one did buy on the Monday 10th September. The stock exchange remained closed for the rest of the week and finally opened up again the following Monday 17th September.
I remember watching the open with everyone expecting a collapse on the open. Miraculously, the market remained buoyant for the first hour of trading and was only marginally down. Market commentators on TV were suggesting the word on the street was "patriotic buying" and they fully encouraged it. This is the most absurd notion I have ever witnessed in all the years I have been following the markets. Patriotic buying! Puuhhhllleeaase!! Sure enough, after about an hour, reality sunk in and the market did indeed plunge.
So, we have two well known black swan events from recent history and the markets gave clear signals beforehand about which side of the market was the right side to be on. Now, I can't explain it but the evidence is there. Some will say it is just a coincidence and that is fine. Ignorance can be bliss!
And I remain convinced that the markets really do have a sixth sense.
By Austin Galt
Austin Galt is The Voodoo Analyst. I have studied charts for over 20 years and am currently a private trader. Several years ago I worked as a licensed advisor with a well known Australian stock broker. While there was an abundance of fundamental analysts, there seemed to be a dearth of technical analysts. My aim here is to provide my view of technical analysis that is both intriguing and misunderstood by many. I like to refer to it as the black magic of stock market analysis.
Email - info@thevoodooanalyst.com
© 2015 Copyright The Voodoo Analyst - All Rights Reserved
Disclaimer: The above is a matter of opinion provided for general information purposes only and is not intended as investment advice. Information and analysis above are derived from sources and utilising methods believed to be reliable, but we cannot accept responsibility for any losses you may incur as a result of this analysis. Individuals should consult with their personal financial advisors.
Austin Galt Archive |
© 2005-2022 http://www.MarketOracle.co.uk - The Market Oracle is a FREE Daily Financial Markets Analysis & Forecasting online publication.