


NASDAQ Stock Index Diverging From SP500
Stock-Markets / Stock Markets 2015 Apr 17, 2015 - 10:42 AM GMTBy: Brad_Gudgeon

 The NASDAQ is showing the same type bearish divergence from the S&P 500 last seen from Nov 28 to Dec 5, 2014. The Lindsay top has a variance of 222/225 trading days placing the last possible top for the S&P 500 on Monday, April 20, 2015. From Dec 5 to Dec 16, 2014, the S&P 500 fell about 5.46% top to bottom over 7 trading days. Following the same pattern places the next low on the FOMC meeting date of April 29, 2015, which also happens to be a Wall Cycle low of 11.25/33.75 trading days from the series starting on Mar 11, and following on Mar 26 and April 14.
What followed the December 16 low was a 7-8 trading day monster rally into Dec 26/29. I can't help but think that the FOMC is going to kick start the market once again out of its funk and create the same buying panic that we had then. This would place the S&P 500 at new all time highs by May 8/11, where the next Bradley turn is due (May 10). Following the same pattern, we see the next low on May 18 (another strong sell-off with a Wall Cycle low of 45 + 2). The pattern skipped along bouncing lows into what would be a final low of June 11 (mirroring the Feb 2 low), just 2 trading days off the expected Major Bradley turn of June 9.
There is a major Bradley turn due April 22, just 2 trading days off the expected top on April 20th. My Elliott/Gann work shows the market hyper-extended from the norm (but permissible) and over-ready for a decline of some magnitude (in this market a 5% drop is a big move!).
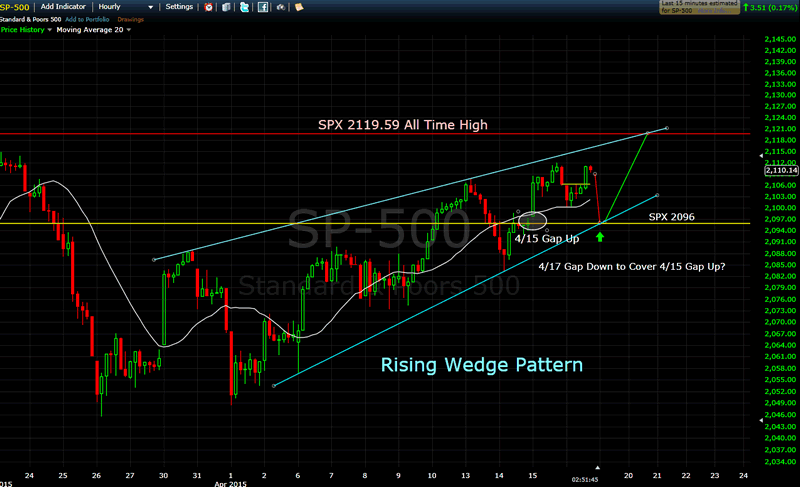
The charts below show the daily S&P 500 and the QQQ. I do expect we cover the gap (made by the rally early Wednesday) near SPX 2096 by early OPEX.
S&P500 Hourly Chart
QQQ Daily Chart
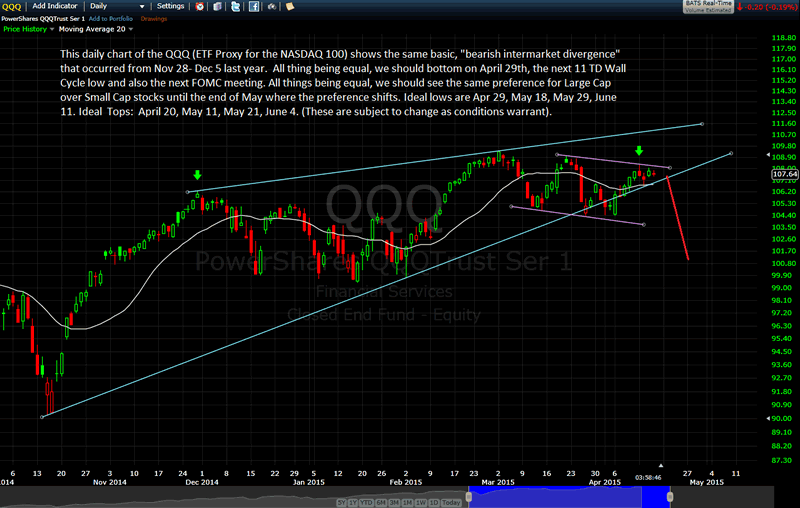
As you can see, the hourly chart of the SPX shows a bearish Rising Wedge Pattern. This is a rising wedge within a larger Rising Wedge. Both assume a waterfall decline coming. The QQQ shows divergence to the SPX, which is a case of inter-market bearish divergence. The market is laboring and may not get much over the 2013/15 area Monday. My volume indicators are showing net money outflows as we rally.
The sideways grind is just about over (IMHO) and the market should get back to some good predictable moves both up and down into at least the early summer. Based on the IMP (Irregular Megaphone Pattern) that I showed earlier this year, I would expect we see an important top in the next few months that leads to a more substantial decline to below 1700 on the S&P 500 sometime this fall. I for one am glad we're about ready to escape this crazy market we've been in for the past few weeks.
Brad Gudgeon
Editor of The BluStar Market Timer
The BluStar Market Timer was rated #1 in the world by Timer Trac in 2014, competing with over 1600 market timers. This occurred despite what the author considered a very difficult year for him. Brad Gudgeon, editor and author of the BluStar Market Timer, is a market veteran of over 30 years. The website is www.blustarmarkettimer.info To view the details more clearly, you may visit our free chart look at www.blustarcharts.weebly.com Copyright 2015. All Rights Reserved
Copyright 2015, BluStar Market Timer. All rights reserved.
Disclaimer: The above information is not intended as investment advice. Market timers can and do make mistakes. The above analysis is believed to be reliable, but we cannot be responsible for losses should they occur as a result of using this information. This article is intended for educational purposes only. Past performance is never a guarantee of future performance.
Brad Gudgeon Archive |
© 2005-2022 http://www.MarketOracle.co.uk - The Market Oracle is a FREE Daily Financial Markets Analysis & Forecasting online publication.