


Are Stock Market Bears Slowly Gaining Control?
Stock-Markets / Stock Markets 2015 Apr 20, 2015 - 08:30 AM GMTBy: Andre_Gratian

 Current Position of the Market
SPX: Long-term trend - Bull Market
Intermediate trend - Is the 7-yr cycle sketching an important top?
Analysis of the short-term trend is done on a daily basis with the help of hourly charts. They are important adjuncts to the analysis of daily and weekly charts which ultimately indicate the course of longer market trends.
ARE THE BEARS SLOWLY GAINING CONTROL?
Market Overview
...several cycle analysts are calling for the bottom of a cycle around 4/17-20.
It is too early to know if the cycle discussed in last week's letter has bottomed. Was it, by waiting until the last minute to make its low, only able to create a sharp one day decline instead of a more extended one? The daily indicators may be saying otherwise. Also, the downtrend from 2111.91 on 4/15 into Friday appears to be an impulse wave, therefore if more weakness lies directly ahead, what follows in terms of structure could decide the short to intermediate fate of the market.
I had mentioned the possibility that SPX may be making a consolidation pattern in the form of a triangle before attempting to reach a new all-time high. For that we would need to see this decline evolve as a corrective wave. If, instead, it remains impulsive, the market may be ready for a more extensive correction after a brief period of consolidation. This will be something for the EW experts to figure out! As of now, they are still very bullish.
I have scrutinized the daily charts of a dozen indexes and most of what I see looks like bearish patterns nearing completion. I will post some of those later instead of our regular set of charts.
Indicators Survey
With Last week's activity, the weekly momentum indicators have turned back down.
The daily MACD has also turned down and is about to make a bearish cross, but it is still positive and has yet to give a confirmed sell signal. The SRSI has gone negative but may find support on an uptrend line.
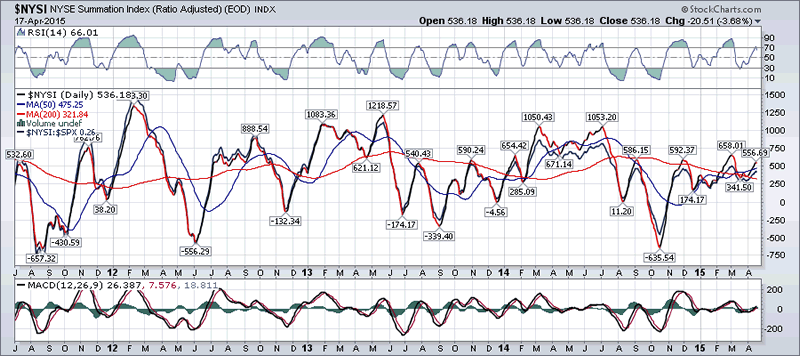
Like the market, the Summation Index (chart below courtesy of StockChart.com) continues to trade in a range. Note, however, that its RSI has reached overbought while the MACD is essentially flat.
The SPX 1X P&F chart has completed a short-term phase count which may be sufficient to put an end to the decline for now, but an ominous pattern is beginning to form above 2074. That level may be taking on a significance which is even greater than the one at 2040 because, if penetrated before SPX makes a new high, it carries more than enough potential count to slice through 2040 in a swift and sharp decline.
With the index failing to break below the 2040 level, the 3X P&F can still be considered to be making a consolidation pattern instead of a large rounding top. However, time is running out as the 7-yr cycle is probably increasing its downward pressure daily.
Chart Analysis
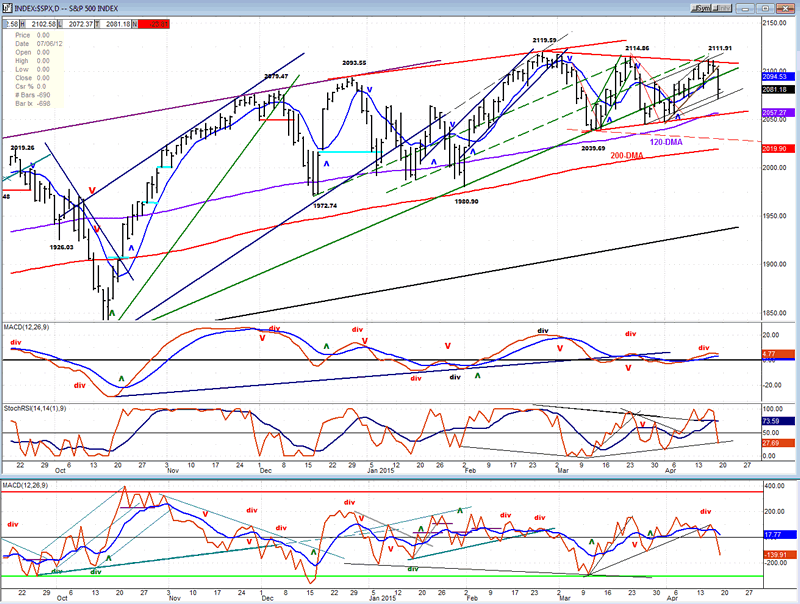
The daily chart of the SPX (courtesy of QCharts.com, as well as others below) looks more and more as if it is slowly rolling over. Since prices came out of the original channel (dark blue) from the October low, and since the SPX rallied until it found resistance on the underneath part of the lower channel line, prices have started a declining tops pattern which needs to be reversed if we are to stop the price erosion which began with the 2119 high and which could accelerate downward at any time. The pattern would worsen if, instead of breaking through the top trend line, it broke through the bottom one and dropped to the dashed trend line. Even Friday's drop makes one wonder if it is not the beginning of increasing weakness. The strong move from the October low has quickly faded and the green trend line, which initially acted as support for prices, is now allowing prices to trade farther and farther outside of its support zone.
Note how the MACD has resisted going negative but continues to weaken and looks more and more vulnerable to doing so. The other two oscillators took a big hit on Friday, and their current
pattern does not suggest that they have already made a low. With the 7-year cycle being within 6 to 9 months from the end of its 7-year phase, it will become increasingly difficult for the market to show some resurging strength. In fact, what we are getting is exactly the type of pattern that one would expect the market to form at this time.
One glance at the hourly chart and it should immediately dissuade anyone from thinking that market moves are random. Support and resistance levels are observed perfectly in the form of trend lines and trend channels. Price knows exactly what to do when it comes to one of them. After finding support on the red trend line at the bottom, the index started to move in two well-defined channels. The steeper blue channel, which showed a strong deceleration pattern at its top as the green channel took over, subsequently provided support after an exact touch of its bottom channel line. Coincidentally, former lows also provided exact support for Friday's decline, stopping the move dead in its tracks and starting an immediate re-bound.
It's a good thing that it did, because if it had broken through (which it could do on Monday if the cycle is still in its down-phase), the decline might have extended all the way down to the red trend line (ca. 2057). If the cycle has bottomed, prices should at least consolidate and start to move higher. But if, instead, the index turns back down and penetrates the red horizontal line drawn at the 2074 level, the overhead supply presents an immediate threat to the bulls. On the P&F chart, all price movement above 2074 (marked with a broad light red line) undoubtedly represents a pattern of distribution which already carries a sizeable potential count.
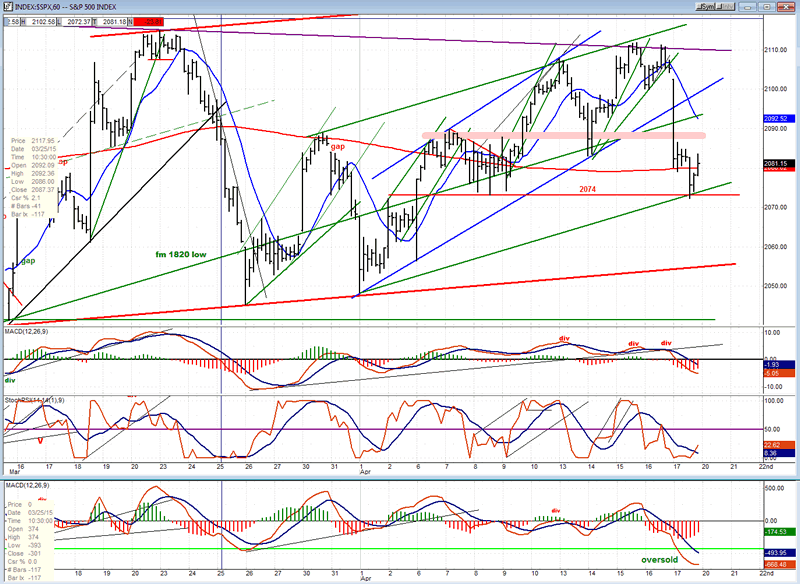
The SRSI is trying to turn up, and the A/D oscillator is oversold. This could help the market to consolidate at this level and attempt an oversold rally. However, the daily indicators (which should have dominance) are not yet in a position to cause the index to rally.
The following charts of some leading indexes have developed negative patterns.
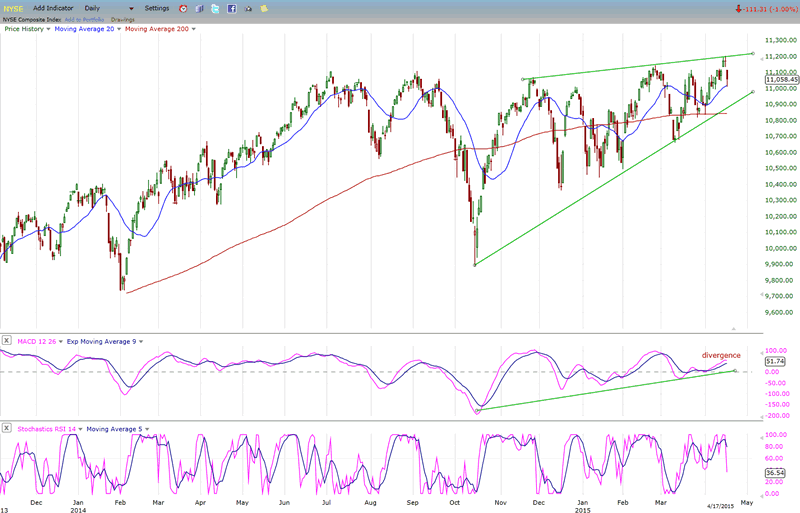
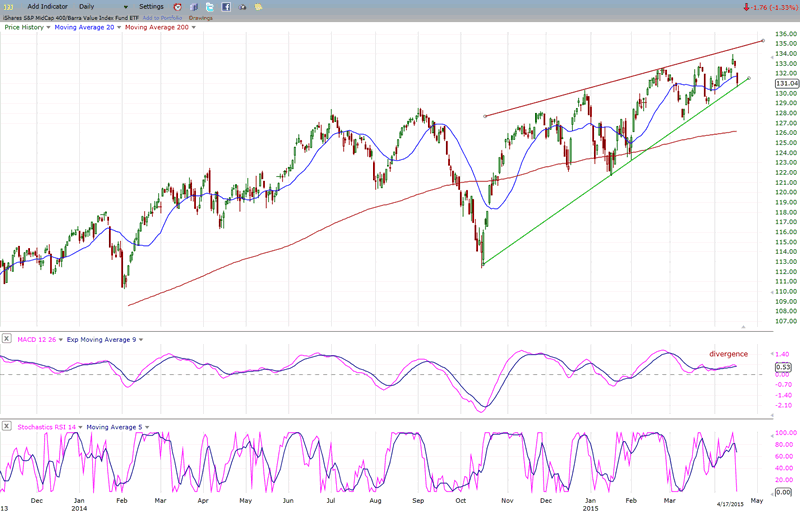
NYA and MID
An up-slanting wedge formation at the end of an uptrend is a bearish pattern. It indicates a loss of upside momentum and a warning that a downward reversal is about to take place. This is confirmed when the lower trend line is broken.
Both NYA and MID show some very distinct wedge patterns but NYA is still above its lower trend line while MID is right on it and, seemingly, about to break it. In both cases, the oscillators are showing near-term negative patterns with the MACD exhibiting negative divergence while the SRSI declined sharply on Friday in what should constitute a short-term sell signal.
Some analysts believe that the normal retracement pattern of a broken bearish wedge is down to the bottom of the formation. Considering the size of the wedge, it would take substantial market weakness to achieve this.
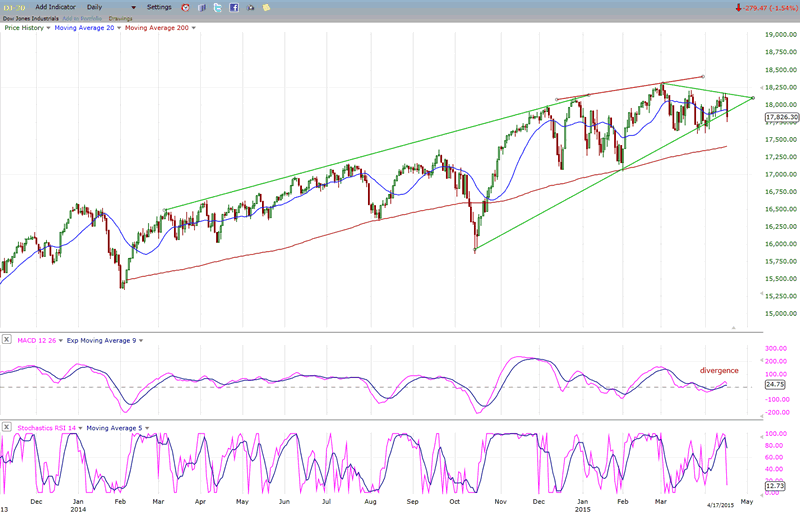
DJIA & TRAN
The Dow Jones Industrial index is making a pattern that is similar to that of the SPX. Since the end of the October rally, prices have shown appreciable deceleration, with the early March high looking like a last gasp effort. Since then, prices have formed a mild downtrend which is currently challenging the uptrend line from the October low. A clean break of that trend line would probably seal the fate of the index and place it at the beginning of a larger corrective pattern, especially if it fails to reverse quickly in another show of strength.
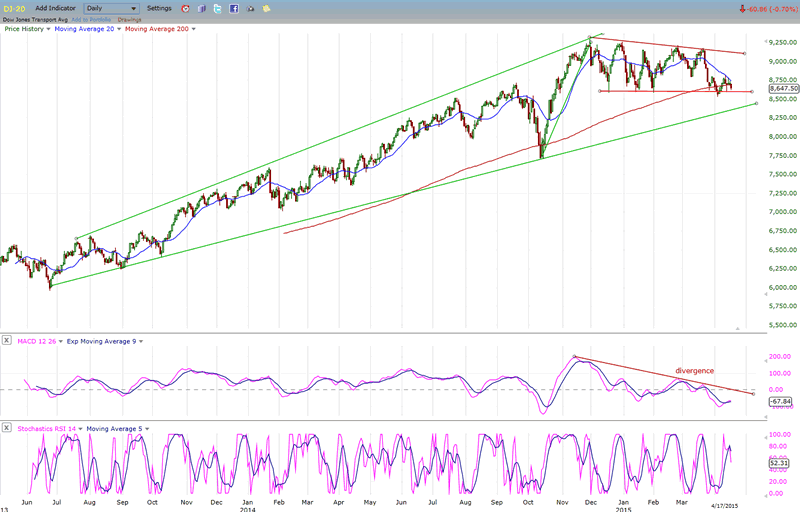
The Transportation Index is making essentially the same pattern but it is weaker and more advanced and appears to be leading the DJIA. While the latter made a new high in March, TRAN did not, which caused the Dow Theory analysts to declare a non-confirmation pattern which normally takes place at the top of a move. The TRAN has already made a series of near-term new highs and lows.
The oscillators of both indexes are also warning of more potential weakness directly ahead.
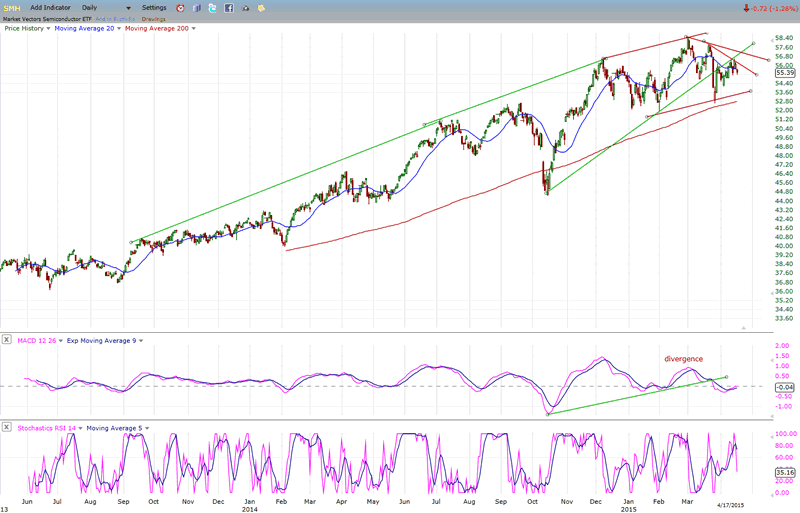
SMH
The semi-conductor ETF looks as if it is a cross between the two patterns above. It was in the process of making a wedge when it underwent a brief period of heavy selling which caused it to break the lower line before the wedge was complete. It may be converting its current pattern into a triangle. We need to give it a little more time. In any case, it has already broken its uptrend line from the October low and back-tested that trend line. Let's give it a chance to show whether or not it has already started a short-term downtrend.
Its oscillators are also bearishly inclined.
Summary
With Thursday's lower high and Friday's sharp sell-off, SPX is continuing its rounding-top pattern. What it does in the next week or so will have a bearing on whether it has truly reversed its uptrend or if it is merely an ongoing consolidation pattern which will be followed by new all-time highs.
The five leading indexes which I have shown above will also be instrumental in clarifying the market's position by their action over the near-term.
FREE TRIAL SUBSCRIPTION
If precision in market timing for all time framesis something that you find important, you should
Consider taking a trial subscription to my service. It is free, and you will have four weeks to evaluate its worth. It embodies many years of research with the eventual goal of understanding as perfectly as possible how the market functions. I believe that I have achieved this goal.
For a FREE 4-week trial, Send an email to: info@marketurningpoints.com
For further subscription options, payment plans, and for important general information, I encourage
you to visit my website at www.marketurningpoints.com. It contains summaries of my background, my
investment and trading strategies, and my unique method of intra-day communication with
subscribers. I have also started an archive of former newsletters so that you can not only evaluate past performance, but also be aware of the increasing accuracy of forecasts.
Disclaimer - The above comments about the financial markets are based purely on what I consider to be sound technical analysis principles uncompromised by fundamental considerations. They represent my own opinion and are not meant to be construed as trading or investment advice, but are offered as an analytical point of view which might be of interest to those who follow stock market cycles and technical analysis.
Andre Gratian Archive |
© 2005-2022 http://www.MarketOracle.co.uk - The Market Oracle is a FREE Daily Financial Markets Analysis & Forecasting online publication.