


U.S. Oil Glut: How High Can It Go?
Commodities / Crude Oil Apr 23, 2015 - 03:21 PM GMTBy: GoldSilverWorlds

 Oil Glut Build in PAD3 Gulf Coast
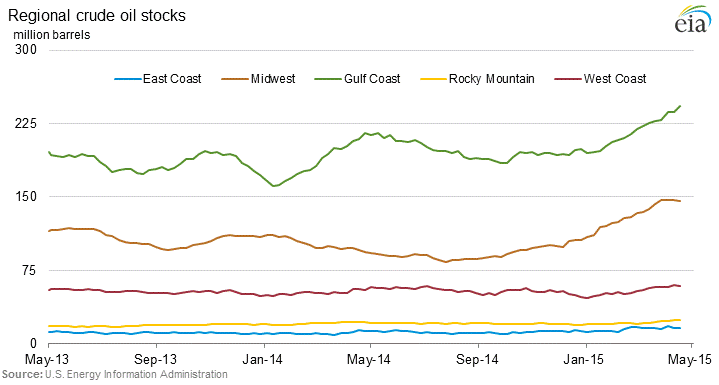 |
| Source: EIA, week ending April 17, 2015 |
Gulf Coast Oil and Gasoline
The better news is that gasoline stockpiles fell 2.1 million barrels to 225.7 million barrels, the lowest level this year. Again, Gulf Coast accounts for almost all the drawdown in gasoline. Distillate stocks were essentially flat rising by 395,000 barrels to 129.3 million barrels.
Products Export Demand Not As Robust
Since U.S. does not ban petroleum products export, the money trade is to move oil away from Cushing, which is the pricing point for NYMEX WTI, to lift WTI price, and into the refineries on the Gulf Coast converting to products like gasoline and diesel to be exported fetching higher prices.
So it looks the new pipeline capacity around Cushing is doing its job moving oil glut from Cushing to Gulf Coast. EIA reported refining capacity utilization fell 1.1% to 91.2%, which is still quite high by historical standard. But judging from the flip flop between the crude and gasoline inventory numbers, the product export demand most likely has not been as robust as expected.
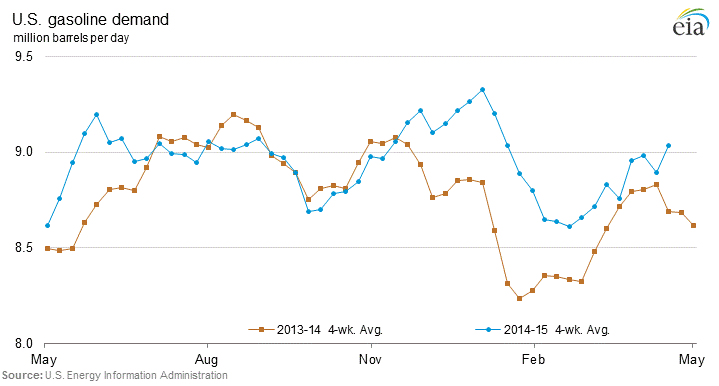
Domestic Gasoline Demand Rising
One bright spot is the rising gasoline demand. Although this is to be expected with the 'new normal' of ~ $50 oil, it nonetheless could suggest certain underlying strength of the U.S. economy.
How High Can You Go?
Right now the question is how high can oil inventory go? Oil market got a little bit encouragement when EIA reported a very slight production decline of 18,000 barrels a day. But that decline came from Alaska, while production in the Lower 48, where shale oil is, stayed unchanged.
For now, EIA still estimates that total U.S. crude oil production will fall by 57,000 barrels per day (bbl/d) in May. WTI closed at $56.33 while Brent was at $62.80 on Wednesday. I think these prices are enough to get the shale E&Ps excited. Remember, many smaller E&Ps are starving for cash and need to produce just to cover interest expense and meeting payrolls. So we might actually see a halt or even a slight production drop as EIA predicted, but it may become short-lived if oil prices stabilize or go above current levels.
By EconMatters
The theory of quantum mechanics and Einstein’s theory of relativity (E=mc2) have taught us that matter (yin) and energy (yang) are inter-related and interdependent. This interconnectness of all things is the essense of the concept “yin-yang”, and Einstein’s fundamental equation: matter equals energy. The same theories may be applied to equities and commodity markets.
All things within the markets and macro-economy undergo constant change and transformation, and everything is interconnected. That’s why here at Economic Forecasts & Opinions, we focus on identifying the fundamental theories of cause and effect in the markets to help you achieve a great continuum of portfolio yin-yang equilibrium.
That's why, with a team of analysts, we at EconMatters focus on identifying the fundamental theories of cause and effect in the financial markets that matters to your portfolio.
© 2014 Copyright EconMatters - All Rights Reserved Disclaimer: The above is a matter of opinion provided for general information purposes only and is not intended as investment advice. Information and analysis above are derived from sources and utilising methods believed to be reliable, but we cannot accept responsibility for any losses you may incur as a result of this analysis. Individuals should consult with their personal financial advisors.
EconMatters Archive |
© 2005-2022 http://www.MarketOracle.co.uk - The Market Oracle is a FREE Daily Financial Markets Analysis & Forecasting online publication.