Gold and Silver Analysis - The Precious Metals Cat has Nine Lives
Commodities / Gold & Silver Mar 11, 2007 - 06:33 PM GMTBy: Dominick
“This is not the end of the bull market in metals and the blue moving average trend lines above should roughly hold. It's still reasonable, though, to expect some more short term weakness until the newfound volatility works to correct the recent overreaction.”
~ Gold and Silver Analysis - One Step Forward, Two Steps Back , March 04, 2007
Last week played out much as expected. Actually, it couldn't have been more perfect. The gap down and early weakness on Monday morning hit the 50-day simple moving averages described in the last update. The overnight move came as the USD/JPY tested support just above 115 and, as anticipated, bounced higher.
Members in the Trading the Charts chatroom knew to watch Monday morning's ISM Services data for a reversal catalyst, and, sure enough, that's exactly what we got in the weaker than expected number that was, nevertheless, better than recessionary. Bottoms are made of such as this.
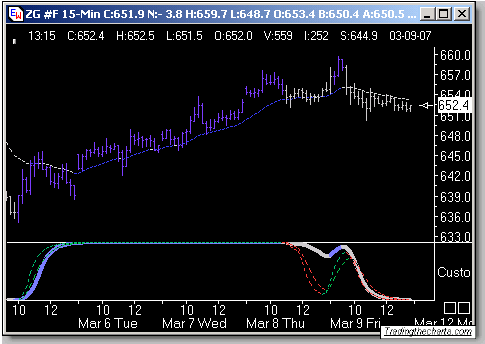
TTC members were also tipped off before the release of the data to watch the inflationary implications of high unit labor cost extend the recovery in metals, which they did. Strong steel output further cemented the move as the yen gradually continued its decline against major currencies. Members saw TTC's proprietary trend cycle charts capture the reversal beautifully, like the one below.

In the end, selling pressure at the close of the trading week capped off what was in all respects only a modest rally in gold and silver. Many analysts were expecting at best a “dead cat bounce” in metals going into last week, and many more might echo that position if there's any further softness in metals next week. Even the update that earlier this year said that the rumors of the metals' death were greatly exaggerated said last week that any upward movement would fail to make new highs. But precious metals are far from dead. Even if there is a retest of support in the next two weeks, vital signs indicate this cat still has plenty of lives.
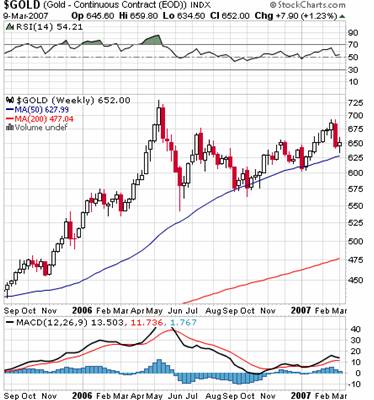
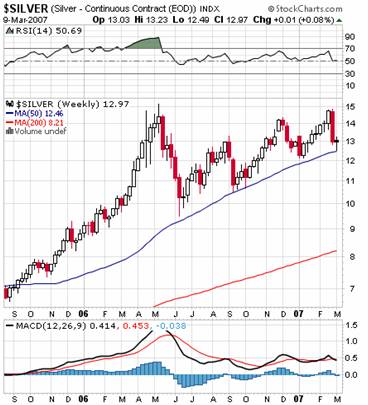
If precious metals were left to pure producer supply and consumer demand alone, the result would be a steady, gentle rise in the price – something like the trendline represented by the 50-day moving average in the charts above. But of course this isn't the case. Instead, as the COT reports have shown over the last two weeks, the movement of large funds in and out of metals ETF's, options, and futures have a profound impact on short term prices, with the result of producing sharp peaks and valleys in these relatively small markets, particularly when sentiment reaches extremes.


The charts above show that, recently, a successful test of the 50-day moving average like we've just seen has been followed by one or more subsequent retests before a new high is finally reached (see specifically June and Sept. 06 and Jan. 07). Unless a catalyst materializes over the next few weeks, another retest will eventually become inevitable, but this should be viewed by long term investors as merely a return to the underlying uptrend and a low risk/reward buy with the right catalyst.
Now that the initial bounce from the recent selloff looks done, it's critical to understand the causes of the decline, its nature, and the forces that will shape the markets from here. Remember first that the selling in metals began over liquidity concerns and was therefore deflationary in nature, as absurd as it might seem given the current flood of capital in all markets. And, as much as it publicly states its intolerance for in flation, the Fed's real bugaboo is de flation and its solution is lower interest rates.
They weren't exactly “predictions”, but remember this update stated in January that, to turn a corner in housing and prevent a recession, the economy must have lower treasury yields and buoyant, if not higher, equities markets in time for spring and summer. It took a dramatic, though ultimately not too damaging correction in stocks, but, as of last week, both of those conditions have materialized.
Glowing confirmation, in fact, came in the form of the Fed's household income data, which had household net worth reaching an all-time high in 2006 with household debt growing at the slowest pace in several years. There's no doubt the bull run from last summer was a major factor in the creation of this pool of potential home buyers which represent a very optimistic signal for the economy. Back in January, yields were threatening to surpass 5%, but with the 10-year note now hovering closer to 4.5% it would certainly seem conditions are ripening for a robust spring and summer buying season in major housing markets which, should it develop, could herald the resurrection of both base and precious metals.
Still, as described last week, mortgage rates remain sticky despite the decline in bond yields. With tighter restrictions on lending and the now infamous sea of adjustable-rate mortgages that represent potential defaults when they reset at higher rates, expectations may reemerge for the Fed to cut once or twice before summer is out. The jobless claims data this Thursday will be a crucial factor in determining the ultimate significance of the frequently revised ADP employment number last week and whether rate cuts could actually be on the table for May or June.
By the Fed's own admission, it does not need much more weakness in the economic data to cut its target rates, just contained inflation expectations. Of course, next week's PPI and CPI numbers will be highly influential in speculation about the decision at the Fed's May meeting and to the future of precious metals. The high labor cost figure from last week suggests future inflation if productivity does not increase, but it's unlikely this surprising figure would manifest consequences in concurrent inflation data. Anyways, strong corporate bond issuance seen last Wednesday and Thursday is a bullish forward-looking indicator that could be raised against the case of labor cost.
Given that the economy appears to have hit a soft patch last month in all but employment, this week's inflation numbers could very well be tame, with an initial neutral to bearish implication for metals. Weakness in retail earnings on Tuesday could also provide difficulty if the bears feel inclined to push, but if the last Friday's employment data was accurate, there could be a chance of beating the very modest expectations. Resilience in the labor market on Thursday would keep the Fed on the sidelines and would likely save both gold and Goldilocks from early graves.
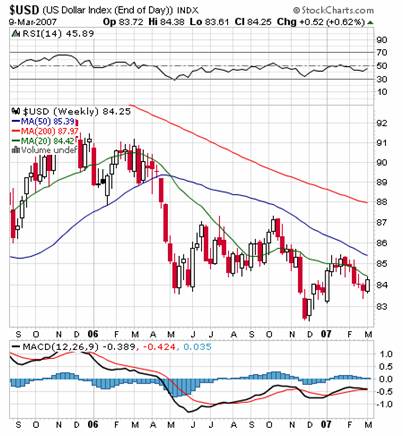
All the focus on the yen and on the stock correction has pushed some fundamental news items to the back of traders' minds that might have otherwise been market movers, but the weekly chart of the trade-weighted dollar index below shows this to also be a crucial juncture for American currency. Metals have borrowed life from the stronger dollar over the past few days, but after a bullish reversal last week, contained inflation figures could have traders sending the dollar index back toward its 50-day moving average, taken out almost a year ago, without necessarily taking gold and silver along for the ride.

Also, though it hardly dominated the headlines, the European Central Bank raised rates again last week with language out of both Frankfurt and London that confirms the trend toward higher interest rates globally, a trend in which the Fed is unlikely to participate anytime soon. Despite the odds of any change in Fed funds rate seeing a decline last week, the dollar could be in a particularly precarious position if data leans the Fed toward cutting. Though it may initially delay a rally in metals, lower interest rates virtually guarantee a rise in inflation and a new birth for precious metals.
For his part, Secretary Paulson is on the record stating that any diversification away from dollar denominated assets likely to result from the reinvestment of hundreds of billions of China's currency reserves would not put upward pressure on U.S. interest rates. China has promised to use at least a portion of its funds to foster development of its most rural regions, which we know is essentially for the commodities bull.
Next week, if earnings and economic data come in roughly as expected, weakness in precious metals could have analysts howling about a dead cat bounce. But to accept this would be to turn your back a snorting bull waiting for a chance to charge again. In the end, with conditions less extreme than last week but emotion still running high, trading this market will continue to be precarious as seemingly minor events could still have dramatic impact.
By Joe Nicholson (oroborean)
Now more than ever, staying on top of daily news and trends with a community of experienced traders like the ones at TTC is of inestimable value. The actual cost, however, is still only $50/month.
© 2005-2022 http://www.MarketOracle.co.uk - The Market Oracle is a FREE Daily Financial Markets Analysis & Forecasting online publication.


