


Stock Market Correction Time?
Stock-Markets / Stock Markets 2015 May 02, 2015 - 03:22 PM GMTBy: Tony_Caldaro

 Another month completed and the choppy activity continues. The market started the week at SPX 2118, gapped up on Monday and hit an all time high of 2126. Then it went into its recent choppy activity again until Thursday: 2095-2116-2097-2114-2091-2103-2079. Then gapped up hitting SPX 2108 on Friday. For the week the SPX/DOW lost 0.35%, the NDX/NAZ lost 1.50%, and the DJ World lost 0.90%. On the economic front reports came in just as mixed. On the uptick: Case-Shiller, personal spending, PCE prices, the Chicago PMI, the WLEI and weekly jobless claims improved. On the downtick: consumer confidence, Q1 GDP, pending home sales, personal income, construction spending and the monetary base. Next week is highlighted by the monthly Payrolls report and ISM services.
LONG TERM: bull market
We continue to track and label this six year bull market, from the March 2009 SPX 667 low to the recent April 2015 SPX 2126 high. Quite an advance from the depths of the great recession. We are counting this bull market as Cycle wave [1]: the first bull market of a multi-generational Super cycle wave 3 bull market. Historically, super cycle bull markets last about 70 – 80 years, with several bull/bear markets along the way. Super cycle wave 1 lasted from the years 1932-2007.
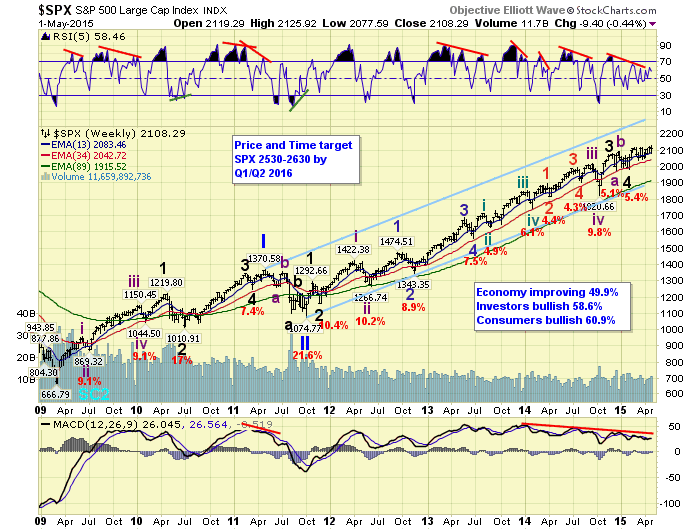
Cycle wave [1] bull markets unfold in five Primary waves. Primary waves I and II completed in 2011, and Primary wave III has been underway since then. During Primary I five Major waves unfolded: with a subdividing Major wave 1 and simple Major waves 3 and 5. During Primary III five Major waves are also unfolding. However this time Major wave 1 was simple, Major wave 3 was quite extended, and Major wave 5 is now underway. When Major 5 concludes, this will also end Primary III. Then after a Primary IV correction, probably the steepest since 2011’s Primary II correction, Primary V will take the market to new all time highs. We still expect a bull market peak in the year 2017.
MEDIUM TERM: uptrend
While Major wave 4 was getting ready to end back in January. The ECB announced the plans for their own quantitative easing program, which has been termed EQE. On the day of the announcement the SPX closed at 2063, and the DAX closed at 10,436. We then made some calculations, using the FED’s QE programs as a guide, and anticipated strong upward moves in the SPX and DAX into 2016. The DAX continued its uptrend, which had started in October, and the SPX started an uptrend on the first trading day of February.
Since the day of the ECB’s announcement, January 22nd, the DAX has risen nearly 19%, recently hitting 12,391 before the April decline. Yet, the SPX has only risen 3%, hitting 2126 this past Monday. In fact, since the late February SPX 2120 high the SPX has remained in a choppy sideways 75 point trading range. Much to the chagrin of bulls and bears alike, as we have all struggled to sort out the short term wave structure.
After making an all time high on Monday, then watching the market fail again to build on those highs, and observing some market leaders lose more than 20% seemingly in hours, we decided to take a look at our long term indicators. We review these indicators when there is a potential completed five wave structure in the market. When we look at the four major indices, the SPX, DOW, NDX and NAZ, we can count a potential five wave structure completed from late 2011. If Major wave 5 is a simple, non-subdividing, uptrend. Thus far it qualifies with recent uptrend highs in the SPX/NAZ/NDX and a downtrend confirmation in the DOW.
Our long term indicators are a combination of six important indices and indicators. At bull market highs, historically, they have all displayed negative divergences as the general market has made new highs. Suggesting extreme caution. At the 2011 Primary I high, 4 of the 6 displayed negative divergences, suggesting caution. The market then had a steep decline in Primary II. In 2013 negative divergences started to build, but the SPX/NAZ/NDX continued to uptrend and they cleared. Currently four of our six indicators have not made new highs since 2014. So negative divergences are building again.
As we reviewed the charts we noticed the weekly RSI/MACD have negative divergences as well (see chart above). The monthly RSI has been in a negative divergence since 2013, and we have just had the first negative MACD crossover since 2011 (see chart below). The last observation is this. During the 2011 Primary I topping out phase the SPX remained in a 120 point trading range for seven months before Primary II kicked in to the downside. Currently the SPX has just entered the seven month of a 150 point trading range, even though the market is 50% higher in value.

What all this analysis suggests, is that it is time to get somewhat defensive until this market starts impulsing again. Primary III may be in the process of topping out. The key level to watch going forward is the 1973 pivot range. Should the market break that range to the downside Primary IV would probably be underway. Then a revisit to the October 2014 low at SPX 1821 would be quite normal, and expected. For now, until the SPX breaks 2040 to the downside it could remain in the same choppy pattern it has for the past two months. Medium term support remains at the 2085 and 2070 pivots, with resistance at the 2131 and 2198 pivots.
SHORT TERM
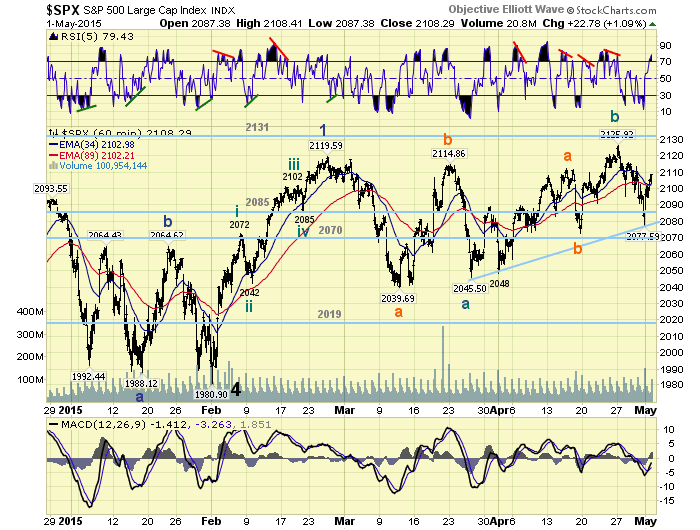
It has been a tough couple of months for those trying to count the short term wave patterns. All potential impulse waves since March ending up looking just as corrective as the pullbacks. There has been a lot of choppy activity with little upside progress. We have tried a few potential impulse patterns, but each time they have broken down. Until we see a clear five wave pattern to the upside, we will view the month long activity from SPX 2046 as some sort of B wave of either Minor 1 or Intermediate ii (see chart below)
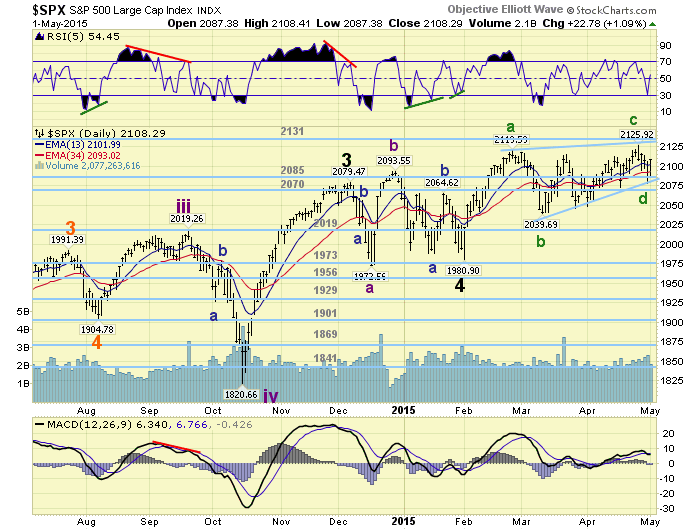
Worse case scenario, as noted above with the many building negative technicals, we can view the entire uptrend from the Major wave 4 SPX 1981 low as an unfolding diagonal triangle Major wave 5 (see daily chart).
The B wave scenario suggests the market tops out soon, and then corrects down to the 2040’s to complete a complex irregular flat. The diagonal scenario suggests the market tops out soon, then drops through the SPX 2040’s area, the Major wave 4 low at SPX 1981, and down to the October 2014 low at SPX 1821. Either way this uptrend should be topping soon, and then we will see what unfolds. Short term support is at the 2085 and 2070 pivots, with resistance at SPX 2115/2120 and the 2131 pivot. Short term momentum ended the week overbought.
FOREIGN MARKETS
The Asian markets were mostly lower losing 1.9%.
The European markets were also mostly lower losing 0.8%.
The Commodity equity group were all lower losing 0.5%.
The DJ World index is still uptrending but lost 0.9%.
COMMODITIES
Bonds are now downtrending and lost 1.3% on the week.
Crude is still uptrending and gained 3.0% on the week.
Gold is also downtrending and lost 0.5% on the week.
The USD is downtrending as well and lost 1.9% on the week.
NEXT WEEK
Monday: a speech from FED governor Tarullo at 9am, then Factory orders at 10am. Tuesday: the Trade deficit and ISM services. Wednesday: the ADP index and a speech from FED chair Yellen. Thursday: weekly Jobless claims and Consumer credit. Friday: monthly Payrolls (est. +234k) and Wholesale inventories. Best to your weekend and week!
CHARTS: http://stockcharts.com/public/1269446/tenpp
http://caldaroew.spaces.live.com
After about 40 years of investing in the markets one learns that the markets are constantly changing, not only in price, but in what drives the markets. In the 1960s, the Nifty Fifty were the leaders of the stock market. In the 1970s, stock selection using Technical Analysis was important, as the market stayed with a trading range for the entire decade. In the 1980s, the market finally broke out of it doldrums, as the DOW broke through 1100 in 1982, and launched the greatest bull market on record.
Sharing is an important aspect of a life. Over 100 people have joined our group, from all walks of life, covering twenty three countries across the globe. It's been the most fun I have ever had in the market. Sharing uncommon knowledge, with investors. In hope of aiding them in finding their financial independence.
Copyright © 2015 Tony Caldaro - All Rights Reserved Disclaimer: The above is a matter of opinion provided for general information purposes only and is not intended as investment advice. Information and analysis above are derived from sources and utilising methods believed to be reliable, but we cannot accept responsibility for any losses you may incur as a result of this analysis. Individuals should consult with their personal financial advisors.
Tony Caldaro Archive |
© 2005-2022 http://www.MarketOracle.co.uk - The Market Oracle is a FREE Daily Financial Markets Analysis & Forecasting online publication.