Electoral Calculus UK Election 2015 Seats Forecast vs Actual Result
ElectionOracle / UK General Election May 09, 2015 - 08:39 PM GMTBy: Nadeem_Walayat
 All of the opinion pollsters got their UK polling badly wrong to such an extent that they were forecasting the party that would end up losing by 100 seats as the one that stood the greatest probability of forming the next government. This article is an analysis of the popular ElectoralCalculus.co.uk election seats forecasting website that I tracked for 3 months in the lead up to the May 7th vote
ElectoralCalculus.co.uk
MO 28th Feb |
Final Result | 7th May | 5th May | 30th Apr | 26th Apr | 19th Apr | 12th Apr | 7th Apr | 29th Mar | 22nd Mar | 14th Mar | 9th Mar | 27th Feb | 30th Jan | |
| Conservative | 296 | 331 | 280 | 282 | 282 | 279 | 282 | 277 | 275 | 274 | 267 | 262 | 267 | 265 | 265 |
| Labour | 262 | 232 | 274 | 275 | 273 | 282 | 280 | 284 | 286 | 287 | 300 | 301 | 298 | 301 | 297 |
| SNP | 35 | 56 | 52 | 52 | 55 | 47 | 48 | 48 | 48 | 48 | 48 | 46 | 55 | 46 | 50 |
| Lib Dem | 30 | 8 | 21 | 18 | 17 | 18 | 17 | 17 | 17 | 17 | 17 | 17 | 15 | 17 | |
| UKIP | 5 | 1 | 1 | 1 | 1 | 1 | 1 | 2 | 2 | 2 | 1 | 1 | 1 | 1 | |
| Others | 22 | 23 | 22 | 22 | 22 | 22 | 22 | 22 | 22 | 22 | 22 |
Electoral Calculus Seats Forecast Converted into the following possibilities:
Conservatives + Lib Dems = 301 - FAIL
Add DUP 8 seats = 309 - FAIL
Labour + Lib-Dems = 295 - FAIL
Labour + Lib-Dems + Plaid Cymru + Greens = 299 - FAIL
Thus according to Electoral Calculus's seats forecast the only workable majority would have been one of a minority Labour government supported by the SNP (52) to total 326.
ElectoralCalculus.co.uk Trend Analysis

ElectoralCalculus.co.uk consistently exhibited a strong bias towards Labour which slowly eroded during the last 6 weeks, though stalled during the final week by moving marginally in Labours favour. In the final analysis ElectoralCalculus.co.uk's seats forecast proved badly wrong for the whole of the 3 month period tracked.
To find out why the opinion pollster forecasters got it so badly wrong then ensure you are subscribed to my always free newsletter as well as to receive continuing in-depth analysis and detailed trend forecasts.
For what actually did prove accurate in forecasting the outcome of the UK general election 2015 I turn to my analysis of December 2013 that is based on house prices rather than opinion polls, and as featured in the UK Housing Market ebook (FREE DOWNLOAD) that converted the UK house prices forecast trend trajectory into expectations for an outright Conservative election victory where the only thing to track was actual house prices data against the forecast trend trajectory so as to fine tune the expected result on approach to the May 7th election day.
30 Dec 2013 - UK House Prices Forecast 2014 to 2018, Inflation, Trend Trajectory and General Election 2015
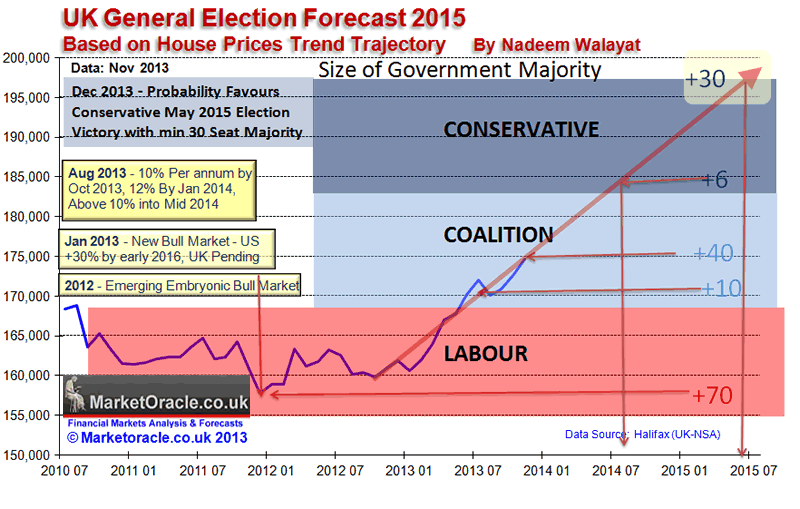
UK General Election Forecast 2015
In terms of the 'fixed' May 2015 general election, the implications of 10% per annum house price inflation for another 18 months, that builds on the housing bull market of the previous 12 months and on the embryonic bull market of 2012 are that probability strongly favours an outright Conservative election victory.
The following graph attempts to fine tune the outcome of the next general election by utilising the more conservative current house prices momentum of 8.5% which has many implications for strategies that political parties may be entertaining to skew the election results in their favour.

In conclusion a May 2015 general election at an average house price inflation rate of 8.5% would result in a Conservative overall majority of at least 30 seats. Therefore this is my minimum expectation as I expect UK house prices to start to average 10% per annum from early 2014 with my actual forecast converging towards average UK house prices breaking to a new all time high just prior to the May 2015 general election which would be a significant boost for housing market sentiment and thus the Conservative's election prospects.
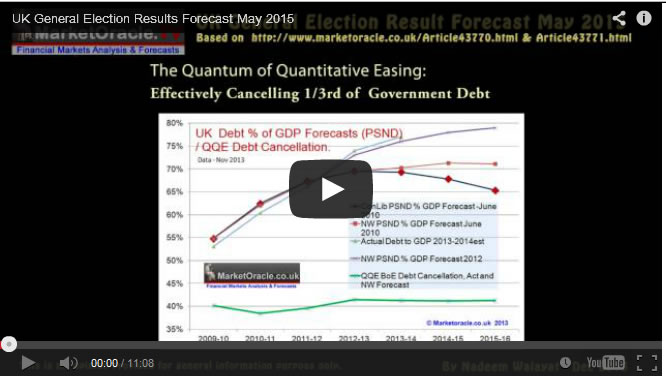
The following video of 6th January 2014 (16 months ago) further illustrates my house prices based UK general election forecast:
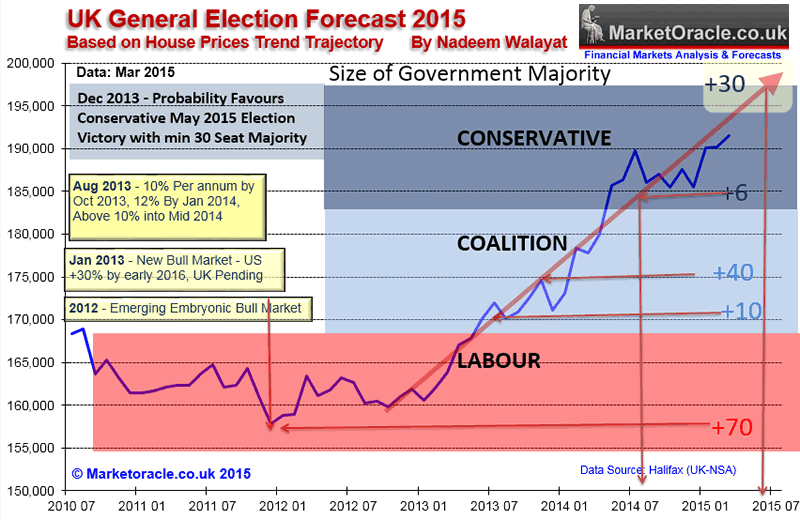
My most recent update of 1st of May confirmed my UK house prices based expectations for an outright Conservative election victory on a small single digits majority -
01 May 2015 - UK Election Forecast 2015 - Who Will Win?
The updated election seats trend graph suggests that the Conservatives are on target towards achieving a single digits outright majority which is completely contrary to every opinion poll published this year. Which if it materialises then I am sure for Election 2020 everyone will be staring at the house prices indices rather than the opinion polls. Though as is usually the case that when the consensus becomes focused on an particular indicator then it usually stops working.

With the accompanying video published on 3rd of May that also confirmed that UK house prices were forecasting a single digit outright Conservative election victory, which was contrary to every opinion poll and political pundit:
Therefore my analysis of UK house prices converted into seats by far proved to be the most accurate forecaster for the UK general election 2015 outcome, and since I have a good idea of how house prices will perform over the next 5 years I can tell you with some confidence that the Conservatives are also likely to win the 2020 general election! Though, in the interests of accuracy do come back to my detailed analysis to conclude in a seats forecast that I will probably publish a year or so before the next general election.
Source and Comments: http://www.marketoracle.co.uk/Article50610.html
By Nadeem Walayat
Copyright © 2005-2015 Marketoracle.co.uk (Market Oracle Ltd). All rights reserved.
Nadeem Walayat has over 25 years experience of trading derivatives, portfolio management and analysing the financial markets, including one of few who both anticipated and Beat the 1987 Crash. Nadeem's forward looking analysis focuses on UK inflation, economy, interest rates and housing market. He is the author of five ebook's in the The Inflation Mega-Trend and Stocks Stealth Bull Market series that can be downloaded for Free.
 Nadeem is the Editor of The Market Oracle, a FREE Daily Financial Markets Analysis & Forecasting online publication that presents in-depth analysis from over 1000 experienced analysts on a range of views of the probable direction of the financial markets, thus enabling our readers to arrive at an informed opinion on future market direction. http://www.marketoracle.co.uk
Disclaimer: The above is a matter of opinion provided for general information purposes only and is not intended as investment advice. Information and analysis above are derived from sources and utilising methods believed to be reliable, but we cannot accept responsibility for any trading losses you may incur as a result of this analysis. Individuals should consult with their personal financial advisors before engaging in any trading activities.
Nadeem Walayat Archive |
© 2005-2022 http://www.MarketOracle.co.uk - The Market Oracle is a FREE Daily Financial Markets Analysis & Forecasting online publication.


