


Stock Market SPX Uptrend Inflection Point
Stock-Markets / Stock Markets 2015 May 23, 2015 - 06:40 PM GMTBy: Tony_Caldaro

 The market opened the week at SPX 2123. It then made marginal new all time highs on Monday, Tuesday, and also Wednesday, before going into a trading range for the rest of the week. The entire range for the week was only 15 points. For the week the SPX/DOW were mixed, the NDX/NAZ gained 0.75%, and the DJ World index gained 0.80%. On the economic front reports for the week were mixed. On the uptick: housing starts, building permits, leading indicators, the WLEI, and the CPI. On the downtick: existing homes sales, the Philly FED, the NAHB, plus weekly jobless claims rose. Next week starts with a Monday holiday, then durable goods and housing sales during the week followed by Q1 GDP and the Chicago PMI on Friday.
LONG TERM: bull market
On Wednesday we concluded a series of special reports over the past week and a half. The reports were on Currencies, Bonds, US Housing, Commodities, Shipping, plus the European and Asian stock markets. If you missed any, and are interested, they were published daily, in order, starting Monday May 11th.
The market started the year at SPX 2059. Thus far it has traded only 78 points below that level in early-February, and 76 points above that level this week. Not much of a range for nearly five months. During this period of time the market made a downtrend low at that SPX 1981 level in early-February, and has been in a choppy uptrend ever since.
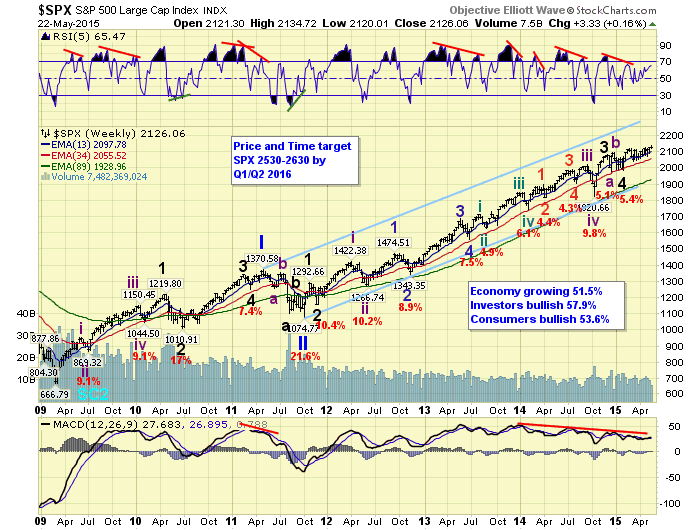
Longer term, we continue to label this bull market as Cycle wave [1]. The previous Cycle [1] was between the years 1932 and 1937. That lasted five years. This one is already in its sixth year, and likely heading toward an eight year bull market. Cycle wave bull markets consist of five Primary waves. Primary waves I and II completed in 2011. Primary wave III has been underway ever since. When Primary III concludes, probably next year at SPX 2500+, the largest correction since 2011 will occur for Primary IV. Then a short-lived Primary V should take the market again to new highs to conclude the bull market.
MEDIUM TERM: still an uptrend
When the current uptrend began in early-February the market impulsed from SPX 1981 to 2120 by late-February. Then after a pullback to SPX 2040 by mid-March, it went into a very choppy pattern: 2115-2046-2126-2068-2135. The most obvious pattern for this choppy activity is an overlapping five wave leading diagonal, rising wedge, which should be terminating at the upper trend line soon. Should this be the correct count, the market should sell off soon and find support around the SPX 2040’s, or the 2019 pivot range, for the correction. After that the market should start a new uptrend to new highs.
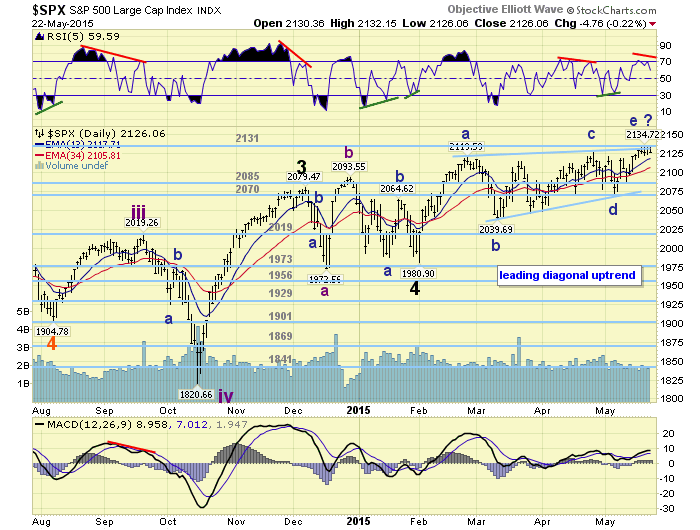
Currently we are still seeing negative divergences on the weekly charts, with new price highs. A negative RSI divergence and MACD crossover on the monthly chart. Plus a small negative RSI divergence on the daily chart, but the daily MACD has nearly cleared to a new high. Fortunately there is an alternative count which will be discussed below. Medium term support remains at the 2085 and 2070 pivots, with resistance at the 2131 and 2198 pivots.
SHORT TERM
This week when the market traded above the OEW 2131 pivot, but still within its seven point range, we took a closer look at the SPX and DOW. After the review we did find a potential impulsive pattern that might unravel the choppiness of the past few months. We posted this count on the DOW hourly chart during the week. Now we move the count over to the SPX hourly chart.
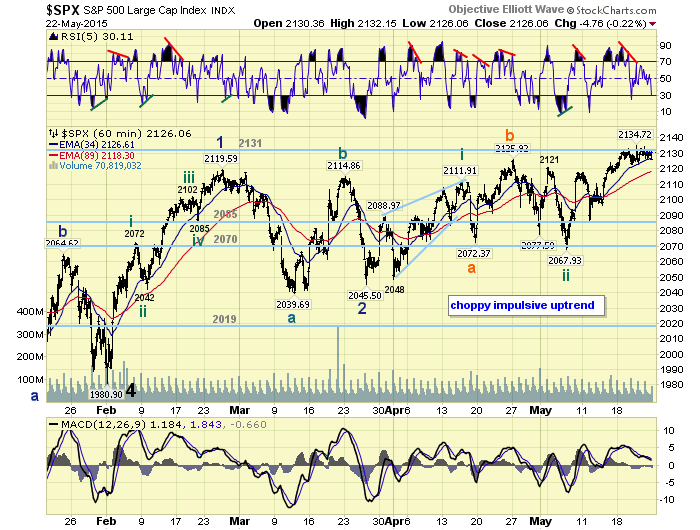
With this count, and the leading diagonal noted above, the market is certainly at an inflection point: breakout or breakdown. In fact, in either scenario, we see less than 5% on the upside and less than 5% on the downside, however the outcome. Short term support is at SPX 2123/2118 and SPX 2110, with resistance at the 2131 and 2198 pivots. Short term momentum ended the week around oversold.
FOREIGN MARKETS
The Asian markets were mostly higher on the week for a net gain of 2.0%.
The European markets were also mostly higher for a net gain of 1.8%.
The Commodity equity group were mostly lower for a net loss of 2.2%.
The DJ World index is still in an uptrend and gained -0.8%.
COMMODITIES
Bonds have been in a downtrend and lost 0.6% on the week.
Crude has been in an uptrend and gained 0.4%.
Gold has also been in an uptrend but lost 1.6%.
The USD has been in a downtrend, but it looks to have reversed, as the USD gained 3.3% on the week, its largest weekly gain since the bull market kicked off in 2011.
NEXT WEEK
Tuesday: Durable goods at 8:30, Case-Shiller and FHFA housing at 9am, New home sales and Consumer confidence at 10am, then a speech from FED vice chair Fischer at 12:30. Thursday: weekly Jobless claims and Pending home sales. Friday: Q1 GDP (est. -0.9%), then the Chicago PMI and Consumer sentiment. Best to your holiday weekend and week!
CHARTS: http://stockcharts.com/public/1269446/tenpp
After about 40 years of investing in the markets one learns that the markets are constantly changing, not only in price, but in what drives the markets. In the 1960s, the Nifty Fifty were the leaders of the stock market. In the 1970s, stock selection using Technical Analysis was important, as the market stayed with a trading range for the entire decade. In the 1980s, the market finally broke out of it doldrums, as the DOW broke through 1100 in 1982, and launched the greatest bull market on record.
Sharing is an important aspect of a life. Over 100 people have joined our group, from all walks of life, covering twenty three countries across the globe. It's been the most fun I have ever had in the market. Sharing uncommon knowledge, with investors. In hope of aiding them in finding their financial independence.
Copyright © 2015 Tony Caldaro - All Rights Reserved Disclaimer: The above is a matter of opinion provided for general information purposes only and is not intended as investment advice. Information and analysis above are derived from sources and utilising methods believed to be reliable, but we cannot accept responsibility for any losses you may incur as a result of this analysis. Individuals should consult with their personal financial advisors.
Tony Caldaro Archive |
© 2005-2022 http://www.MarketOracle.co.uk - The Market Oracle is a FREE Daily Financial Markets Analysis & Forecasting online publication.