


Stock Market Correction Continues
Stock-Markets / Stock Markets 2015 Jun 13, 2015 - 10:01 PM GMTBy: Tony_Caldaro

 Another day traders week. After starting the week at SPX 2093 the market traded down to 2072 by Tuesday morning. After that a sharp rebound occurred, helped by two gap up openings, to SPX 2115 by Thursday morning. Then the market started to retreat again, ending the week right about where it began. For the week the SPX/DOW gained 0.15%, the NDX/NAZ lost 0.40%, and the DJ World index gained 0.40%. On the economic front reports came in with a strong positive bias. On the uptick: retail sales, business/wholesale inventories, export prices, the PPI, consumer sentiment, plus the budget deficit improved. On the downtick: investor bullishness, the WLEI and weekly jobless were higher. Next week will be highlighted by the FOMC meeting, Industrial production and reports on Housing.
LONG TERM: bull market
While the SPX has traded within a 160 point range for the past seven plus months it has generated five trend reversals, or medium term waves. And made marginal new all time highs at each of the three uptrend tops: 2079, 2094, 2135. Obviously not much progress has been made since the SPX 2079 uptrend high in December, despite strong rallies in several foreign markets during the same period. Nevertheless the bull market continues to unfold in what appears to be an upper level consolidation period, before the market moves substantially higher.
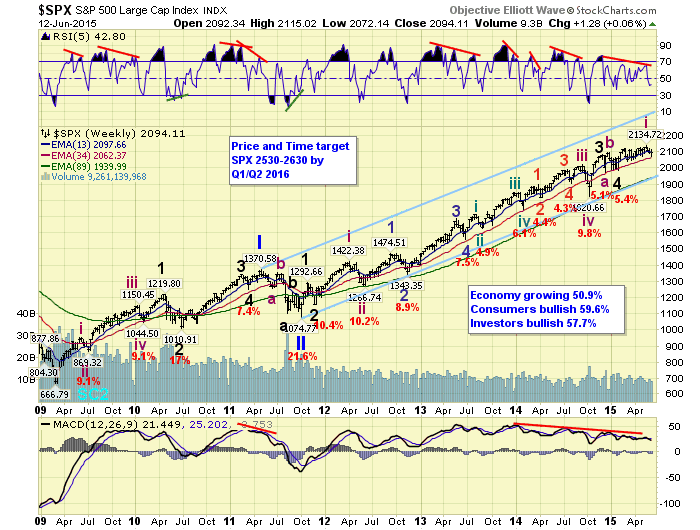
No change in the long term count. Cycle wave [1] has been underway since 2009. The first two Primary waves, of this five primary wave bull market, ended in 2011. Primary wave III has been underway since that October 2011 low. When Primary III does conclude, we expect in 2016 around SPX 2500+, the largest correction since 2011 should unfold for Primary IV. Then a Primary V series of waves should carry the market to all time highs again. Thus far we are looking for it to conclude in 2017.
MEDIUM TERM: downtrend
From the downtrend low in February at SPX 1981, the market rallied strongly throughout that month hitting a high of 2120. After that the market entered a very choppy two and half month period, with the entire range only 95 points. We labeled this entire activity from the early February low as a leading a-b-c-d-e diagonal triangle.
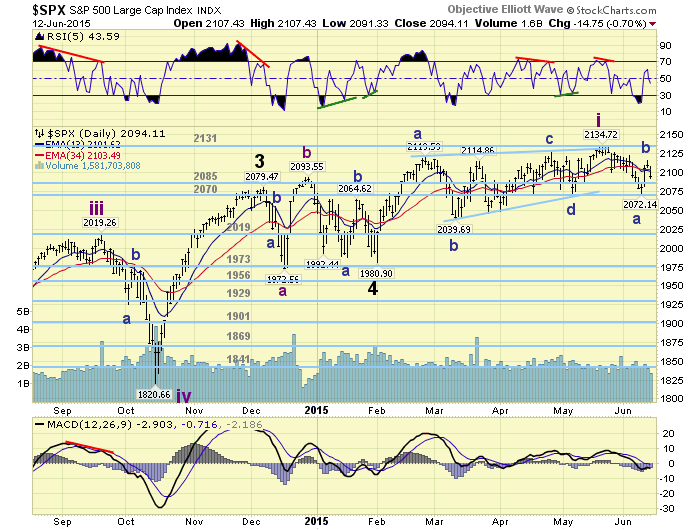
After the high was made in mid-May at SPX 2135 the market entered a downtrend. Downtrends after leading diagonal uptrends are usually fairly swift to the downside. This downtrend, now several weeks along, has been just as choppy as the latter part of the uptrend. This suggests the impulsive part of the uptrend might have ended in February, and since then the market has been forming a complex irregular flat.
Whether it is counted as a leading diagonal, or an irregular correction, the downtrend should lead to the same levels: SPX 2040’s or the 2019 pivot. If an irregular complex flat, support is at the A wave SPX 2040. If an irregular complex zigzag, support should be found around the 2019 pivot range. Under the leading diagonal scenario a 61.8% retracement of the entire advance is SPX 2040, with worse case the 2019 pivot range as well. Medium term support remains at the 2085 and 2070 pivots, with resistance at the 2131 and 2198 pivots.
SHORT TERM
We have been counting this Intermediate wave two downtrend with a series of a-b-c’s. We have three Minute waves down for Minor A at SPX 2099. Then a Minor B rally to SPX 2122. This is followed by a Minute a to SPX 2072, a Minute b to SPX 2115, and now a Minute c underway.
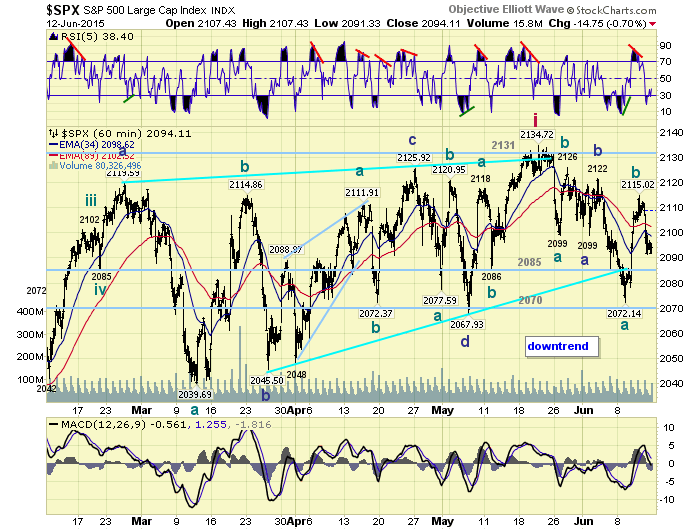
Another possibility suggests a Minor wave A to SPX 2072, a Minor wave B to SPX 2115, and now a Minor wave C currently underway. This is posted on the SPX daily chart. Again, in either case it appears the downtrend should continue until the market gets sufficiently oversold. And, the NDX/NAZ confirm downtrends as well. Optimistically, this could all occur during the upcoming week. If not, we may stay in a day traders market until month’s end. Short term support is at the 2085 and 2070 pivots, with resistance at SPX 2099 and SPX 2118. Short term momentum ended the week just above oversold.
FOREIGN MARKETS
The Asian markets were quite mixed on the week for a net loss of 0.2%.
The Europeans markets were mostly lower for a net loss of 0.4%.
The Commodity equity group were mixed and gained 0.7%.
The DJ World index remains in a downtrend but gained 0.4% on the week.
COMMODITIES
Bonds are still in a downtrend and lost 0.4%.
Crude is still in an uptrend and gained 1.8%.
Gold continues to downtrend and lost 0.6%.
The USD remains in a downtrend and lost 1.4%.
NEXT WEEK
Monday: NY FED at 8:30, Industrial production at 9:15, then NAHB housing at 10am. Tuesday: Housing starts and Building permits. Wednesday: FOMC statement. Thursday: weekly Jobless claims, the CPI, the Philly FED and Leading indicators. Best to your weekend and week!
CHARTS: http://stockcharts.com/public/1269446/tenpp
After about 40 years of investing in the markets one learns that the markets are constantly changing, not only in price, but in what drives the markets. In the 1960s, the Nifty Fifty were the leaders of the stock market. In the 1970s, stock selection using Technical Analysis was important, as the market stayed with a trading range for the entire decade. In the 1980s, the market finally broke out of it doldrums, as the DOW broke through 1100 in 1982, and launched the greatest bull market on record.
Sharing is an important aspect of a life. Over 100 people have joined our group, from all walks of life, covering twenty three countries across the globe. It's been the most fun I have ever had in the market. Sharing uncommon knowledge, with investors. In hope of aiding them in finding their financial independence.
Copyright © 2015 Tony Caldaro - All Rights Reserved Disclaimer: The above is a matter of opinion provided for general information purposes only and is not intended as investment advice. Information and analysis above are derived from sources and utilising methods believed to be reliable, but we cannot accept responsibility for any losses you may incur as a result of this analysis. Individuals should consult with their personal financial advisors.
Tony Caldaro Archive |
© 2005-2022 http://www.MarketOracle.co.uk - The Market Oracle is a FREE Daily Financial Markets Analysis & Forecasting online publication.