


Valuable Clues from the Oil Stocks to Crude Oil Price Ratio
Commodities / Oil Companies Jun 15, 2015 - 05:19 PM GMTBy: Nadia_Simmons

 In our essay on oil stocks from June 9, we focused on the connection between the XOI and the general stock market to find out what impact the S&P500 index could have on the oil stock index’s future moves. Back then, we also wrote about the relationship between the oil stocks and crude oil:
(...) The beginning of May brought a new 2015 high of $62.58 in crude oil, but we didn’t see a fresh high in case of oil stocks. In the following weeks, crude oil has been trading in a narrow range and erased less than 38.2% of earlier rally. What happened at the same time with the XOI? The index declined sharply and approached the 61.8% Fibonacci retracement in the recent days, showing its weakness in relation to light crude.
In the previous week, this negative correlation has been also in place and crude oil gained 1.80%, while oil stocks remained almost unchanged (they lost 0.02%). Taking the above into account, we’ve decided to examine the oil-to-oil stocks ratio to find out what can we infer from it about crude oil’s future moves (charts courtesy by http://stockcharts.com).
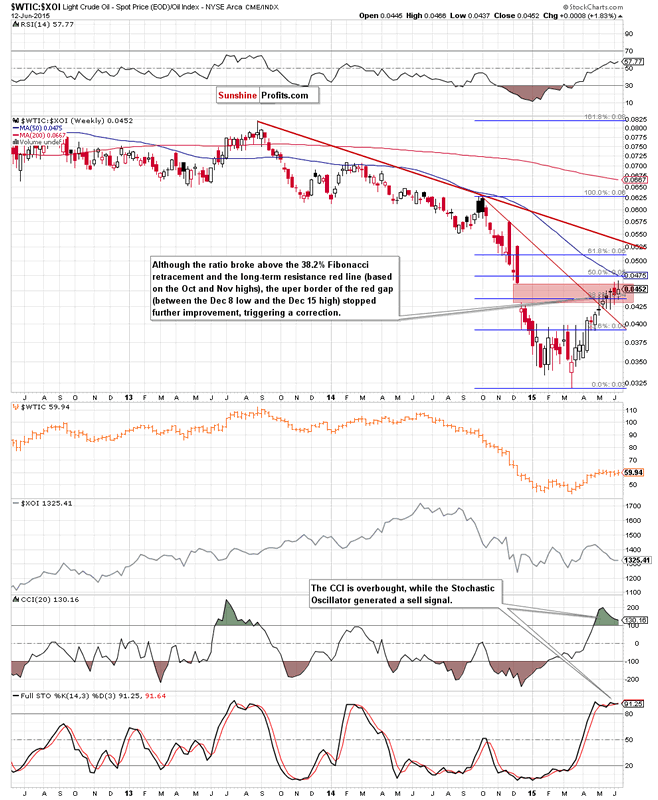
Looking at the above chart, we see that the ratio moved higher in the previous weeks and broke above the 38.2% Fibonacci retracement and the long-term red resistance line (based on the Oct and Nov highs). Despite this improvement, the upper border of the red gap between the Dec 8 low and the Dec 15 high stopped further improvement, triggering a pullback.
Although the ratio rebounded in the previous week, the major resistance level continues to keep gains in check. Taking the above into account, and combining it with the current position of the indicators (the CCI and Stochastic Oscillator are overbought, while the latter generated a sell signal), we think that lower values of the ratio are just around the corner. If this is the case, and we see a decline from here, such price action will likely translate to a pullback in light crude – similarly to what we saw in the previous months.
Having said that, let’s find out whether we can infer something more from the stocks-to-oil ratio or not.
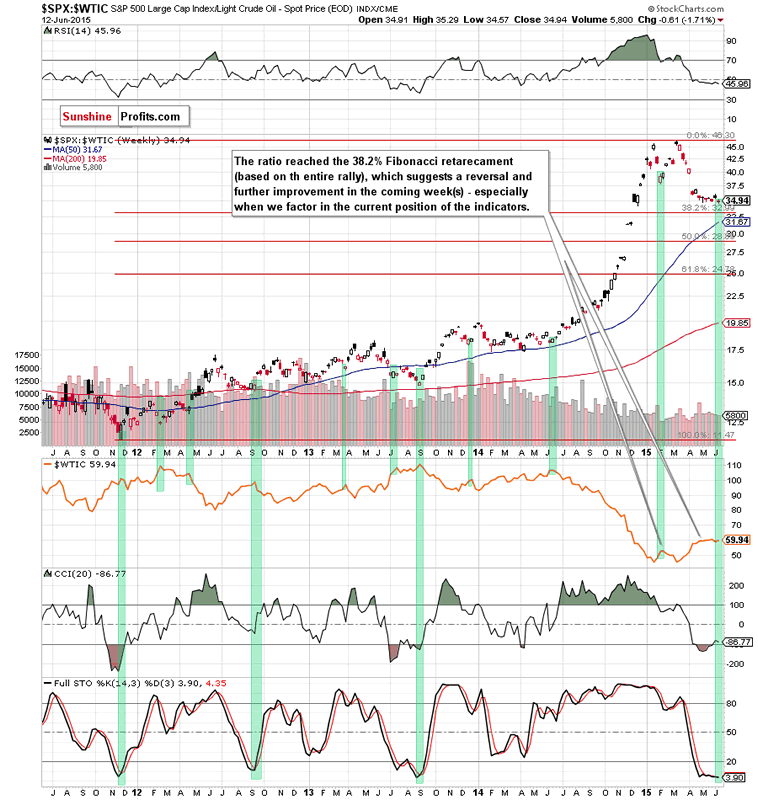
From this perspective, we see that the ratio reached the 38.2% Fibonacci retracement based on the entire rally, which suggests reversal and further improvement in the coming weeks – especially when we factor in the current position of the indicators (the CCI generated a buy signal, while the Stochastic Oscillator is extremely oversold and very close to doing the same).
What does it mean for crude oil? As you see on the above chart, many times in the past (we marked them with green) local bottoms in the ratio have corresponded to local tops in crude oil. Therefore, if we see a rebound and rally from here, the probability of a pullback in the commodity will increase.
To have a more complete picture of the oil market, we also decided to examine the WTIC:USD ratio.
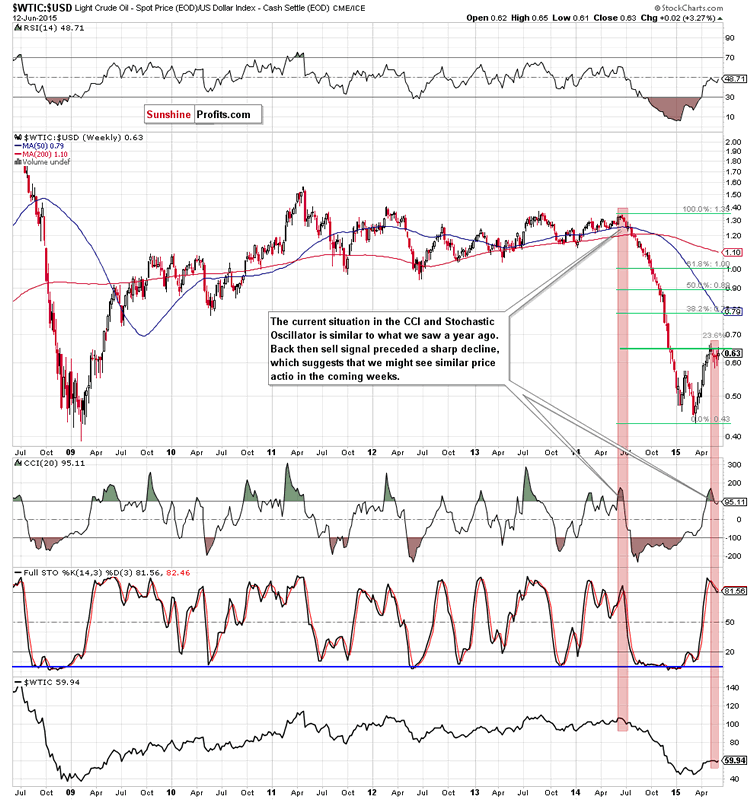
From today’s point of view we see that the current situation in the CCI and Stochastic Oscillator is similar to what we saw a year ago. Back then, sell signals generated by the indicators preceded a sharp and sizable decline, which took the commodity below $50. Taking this fact into account, it seems that history will repeat itself once again and we’ll see lower values of the ratio and crude oil in the coming week(s). If this is the case, the initial downside target would be around 0.573, where the Feb highs are.
Summing up, crude oil still remains below the May and June highs and the key resistance zone created by the long-term blue resistance line and the 200-month moving average. However, taking into account the current position of the ratios, which reached important support/resistance levels (in all cases their reversals will translate to pullback in crude oil), we believe that lower values of crude oil are just around the corner – especially when we factor in the fact that similar values of the CCI and Stochastic Oscillator (in case of the stocks-to-oil and oil-to-usd ratios) preceded huge declines, which took the commodity to the multi-month low of $42.41.
Please note that you can find other interesting ratios that give us valuable clues about crude oil’s, oil stocks’ and even gold’s future moves in our monthly Oil investment Updates. If you enjoyed the above analysis, we invite you to sign up for our free mailing list and stay up-to-date with our other free articles. It’s free and if you don’t like it, you can easily unsubscribe. Sign up today.
Thank you.
Nadia Simmons
Sunshine Profits‘ Contributing Author
Oil Investment Updates
Oil Trading Alerts
* * * * *
Disclaimer
All essays, research and information found above represent analyses and opinions of Nadia Simmons and Sunshine Profits' associates only. As such, it may prove wrong and be a subject to change without notice. Opinions and analyses were based on data available to authors of respective essays at the time of writing. Although the information provided above is based on careful research and sources that are believed to be accurate, Nadia Simmons and his associates do not guarantee the accuracy or thoroughness of the data or information reported. The opinions published above are neither an offer nor a recommendation to purchase or sell any securities. Nadia Simmons is not a Registered Securities Advisor. By reading Nadia Simmons’ reports you fully agree that he will not be held responsible or liable for any decisions you make regarding any information provided in these reports. Investing, trading and speculation in any financial markets may involve high risk of loss. Nadia Simmons, Sunshine Profits' employees and affiliates as well as members of their families may have a short or long position in any securities, including those mentioned in any of the reports or essays, and may make additional purchases and/or sales of those securities without notice.
© 2005-2022 http://www.MarketOracle.co.uk - The Market Oracle is a FREE Daily Financial Markets Analysis & Forecasting online publication.