How Inflation Will Destroy Home Owners Equity
Housing-Market / UK Housing Jun 18, 2008 - 01:35 AM GMTBy: Nadeem_Walayat
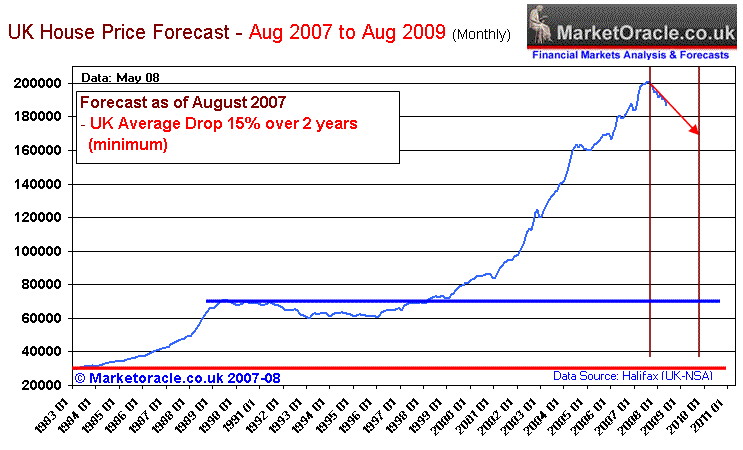
 The UK housing boom has seen house prices rise from a low of £60.096 in 1993 (Halifax UK:NSA) to a high of £201.081 by August 2007. A whopping gain of 334%. The below graph illustrates the remarkable strong trend higher, where even the measured forecast downtrend of 15% only measures as a minor blip on the long-term trend of ever higher house prices.

Looking at the above graph it is hard to believe why so much distress was voiced of the 1990's housing bear market which barely registers on the graph. Yes house prices fell from £70,588 in 1989 to £60,196 in 1993, a fall of 15% but after a period of consolidation soon recovered to pass the previous peak. So why did the housing market have such an significant impact on the economy, why did so many home owners hand back their keys as repossessions surged ?
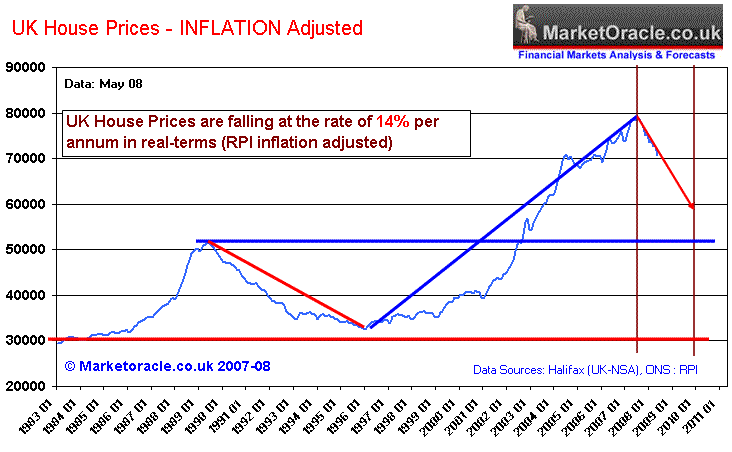
The answer is illustrated in the below graph which shows inflation adjusted house prices. As the housing market stalled and started to fall, home owners were hit hard by the real impact of real terms falls in house prices. Who wants to hold an asset that is going to year on year lose value ? Which is why the house prices remained depressed for TEN years, not because they were expensive, but because of fear of real terms loss of value when inflation is taken into account.

Today's home owners despite the fall in house prices of 7%, have yet to incorporate into their psyche of real terms loss of value, which will be with the housing market long after the UK housing market stops falling. The implications are that the UK housing market could yet again be depressed by a further decade of stagnating house prices on a real terms basis that will ensure houses being seen as an asset that will lose money in real-terms, by which time the housing market will probably have reached the next buying point.

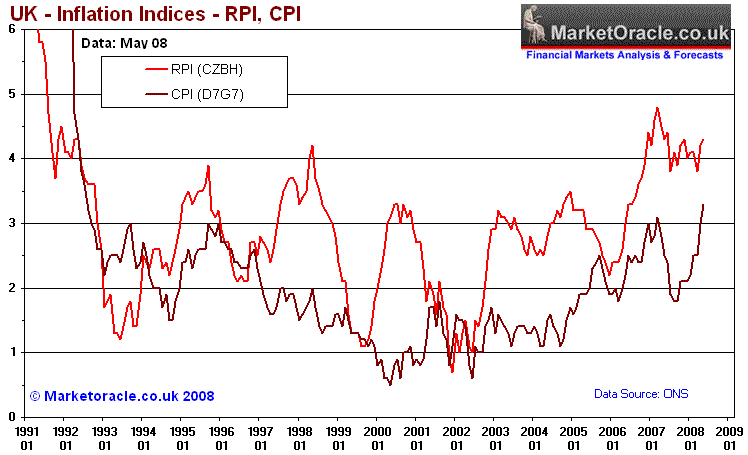
The above inflation graph should dispel the notion that inflation was inordinately high during the 1990's stagnant housing market than the present. The graph clearly shows that inflation this time around seems set to be higher on an average basis and thereby sends a warning shot to those that view housing as a long-term investment. THis is the wrong time to be invested in property as the scene is set for a 50% to 60% fall in UK house prices from the Peak to the eventual inflation adjusted trough.
Analysis of the UK Housing Market:
By Nadeem Walayat
Copyright © 2005-08 Marketoracle.co.uk (Market Oracle Ltd). All rights reserved.
Nadeem Walayat has over 20 years experience of trading, analysing and forecasting the financial markets, including one of few who both anticipated and Beat the 1987 Crash. Nadeem is the Editor of The Market Oracle, a FREE Daily Financial Markets Analysis & Forecasting online publication. We present in-depth analysis from over 150 experienced analysts on a range of views of the probable direction of the financial markets. Thus enabling our readers to arrive at an informed opinion on future market direction. http://www.marketoracle.co.uk
Disclaimer: The above is a matter of opinion provided for general information purposes only and is not intended as investment advice. Information and analysis above are derived from sources and utilising methods believed to be reliable, but we cannot accept responsibility for any trading losses you may incur as a result of this analysis. Individuals should consult with their personal financial advisors before engaging in any trading activities.
Attention Editors and Publishers! - You have permission to republish THIS article if published in its entirety, including attribution to the author and links back to the http://www.marketoracle.co.uk . Please send an email to republish@marketoracle.co.uk, to include a link to the published article.
Nadeem Walayat Archive |
© 2005-2022 http://www.MarketOracle.co.uk - The Market Oracle is a FREE Daily Financial Markets Analysis & Forecasting online publication.


