China Crisis Stock Market Hyper-Oversold Condition Calls for Bounce - Target...
Stock-Markets / China Stocks Jul 09, 2015 - 03:24 PM GMTBy: Clive_Maund
 It's a shame more Chinese investors didn't get to read our timely warning of an impending mega-smash in the Chinese stockmarket - it would have been worth the cost of a subscription TO AVOID LOSING THEIR LIFE'S SAVINGS.
It was mentioned as an aside yesterday's update on the oil sector, in which we took huge profits in United States Oil Fund Puts, that the Chinese market was massively oversold and now exhibiting extreme technical compression and thus starting to look attractive for a rebound, and we will now proceed to see exactly why that is on the charts for the Shanghai Composite Index.
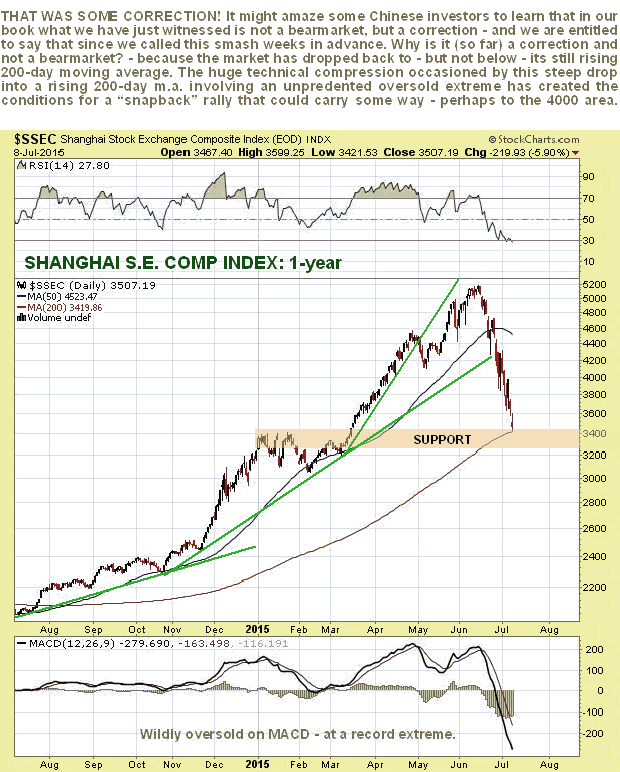
The first thing to note on the 1-year chart for the Shanghai Composite Index shown below is the point at which the China Crash article was posted on the site, and sent out into the wider world, which was towards the end of April. Sadly, few Chinese investors got to read it, and if they did they would probably have ignored it, because they were blinded by the lust for a quick profit. After that article was posted the market broke its very steep 3rd fan trendline, which was a warning shot across the bows, and reacted back some, but then proceeded to rise even higher, before turning on a dime in the middle of June and tipping into a ferocious decline that surprised even us in its unrelenting intensity - we were expecting some sort of bounce from about the 4100 - 4150 level where there was support but it just kept dropping. The government started to intervene to try to stem the decline and companies halted trading in their stock, to no avail.

Despite the mayhem of recent weeks the amazing thing is that the market still hasn't dropped beneath its rising 200-day moving average, which is an indication of how wildly overbought it got earlier. In our book that usually means it's still a bullmarket, and it will be until it drops below this indicator and it turns down. However, the ferocity of the decline and the incredible change of sentiment is certainly a strong indication that we have witnessed a reversal of major importance.
From as technical and practical standpoint however, the brutal decline straight down to the rising 200-day moving average has resulted in extraordinarily oversold readings - the market has never been this oversold in its entire history - and a very high degree of technical compression and negative sentiment extremes that have created the conditions for a dramatic "snapaback" rally, especially as the market has arrived not just at its 200-day moving average, but also at an important support level at the January peak. How high could it bounce back quickly on a snapback rally? - an educated guess is the 4000 area.
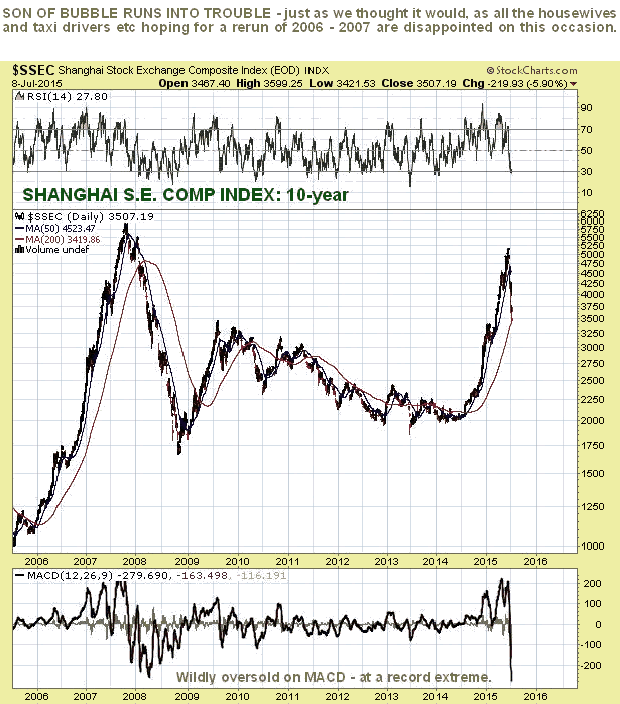
It's worth looking briefly at the 10-year chart to see how this bursting bubble, which we earlier named Son of Bubble, compares to the 2006 - 2007 bubble, and how oversold it is now compared to when that earlier bubble burst. Those low grade investors who were seduced into thinking that the Son would measure up to his Dad made a grave mistake, and we knew they were making it, because the economic fundamentals of China simply do not justify a major ramp in the stockmarket - growth is anemic and the country is encumbered with massive careening deficits. The entire country is now a bubble that is destined to implode. How about that for a black swan? - take note US stockmarket investors!

Even during the worst declines within the 2008 crash, when the big bubble popped, the market was never as oversold as it is now, as we can see on the MACD indicator at the bottom of the chart. This is another reason that a sharp bounce here is likely, but it should quickly fizzle out perhaps in the 4000 area and reverse into another decline, as backed up selling hits the market again.
China is not some irrelevant sideshow, it is the 2nd biggest economy in the world, and US consumers are accustomed to having their lifestyles enhanced by cheap Chinese goods, right down to souvenir US flags and baseball bats. What happens there is thus of great importance not just to the markets, but to consumers generally the world over.
By Clive Maund
CliveMaund.com
For billing & subscription questions: subscriptions@clivemaund.com
© 2015 Clive Maund - The above represents the opinion and analysis of Mr. Maund, based on data available to him, at the time of writing. Mr. Maunds opinions are his own, and are not a recommendation or an offer to buy or sell securities. No responsibility can be accepted for losses that may result as a consequence of trading on the basis of this analysis.
Mr. Maund is an independent analyst who receives no compensation of any kind from any groups, individuals or corporations mentioned in his reports. As trading and investing in any financial markets may involve serious risk of loss, Mr. Maund recommends that you consult with a qualified investment advisor, one licensed by appropriate regulatory agencies in your legal jurisdiction and do your own due diligence and research when making any kind of a transaction with financial ramifications.
Clive Maund Archive |
© 2005-2022 http://www.MarketOracle.co.uk - The Market Oracle is a FREE Daily Financial Markets Analysis & Forecasting online publication.


