


Stock Market in Danger of Bear Slide
Stock-Markets / Stock Markets 2015 Jul 20, 2015 - 07:23 AM GMTBy: Brad_Gudgeon

 Last week I was looking for a short term low Monday and a rally into Wednesday, then down into week's end. The short term low occurred on Sunday in the futures market then sky rocketed all the way into Friday, July 17. In the past, whenever I've seen the 8 TD top go 10 TD's on a 16 TD top area, the market got over extended and lead to hard selling the following week.
Clearly, my forecast was a miss, but I don't think the next one will be too far off. We have the 16 TD low due July 22-24 (July 24 if we go 18 TD's like the last top). The next top is the 8 TD top due right on the FED meeting date July 29. The following week sees the 5/40 wk low due around the 5th of August.
Astro-wise, we have Venus going retrograde on July 25. Venus rules changes in interest rate policy. Uranus goes retro on July 26 and squares Mars the day before. These are power reversal signatures that have an orb of 4-12 TD's influence. Saturn turns direct on August 1 and is playing with Scorpio. All this means is: expect the unexpected...things are not the way they seem.
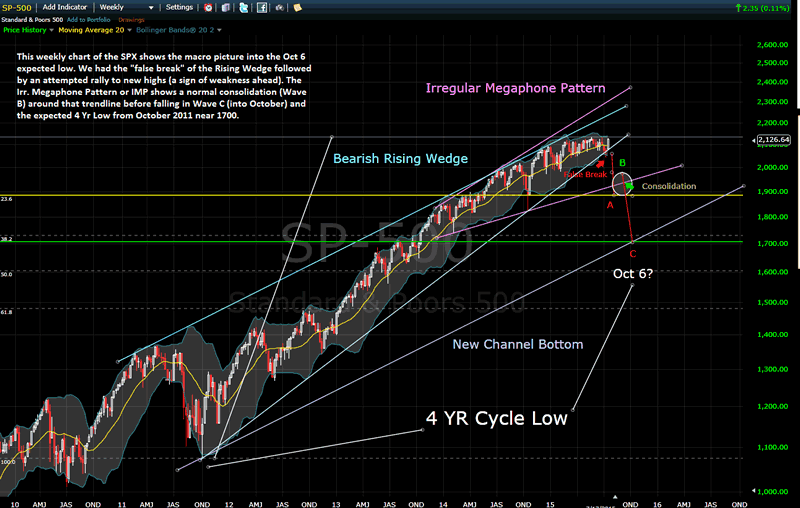
The weekly chart below shows a 'false break' of a rising wedge pattern going back to early October 2011. This implies a 'sign of weakness' ahead and a possible move to the lower 1700's by early October. The IMP (Irregular Megaphone Pattern) outlined in magenta is a topping pattern. Usually, the market falls to around or near the rising lower trend line on the IMP and goes into a sideways bear flag pattern before falling further into the expected bottom (just below the lower touch point of the IMP at 1737 SPX).
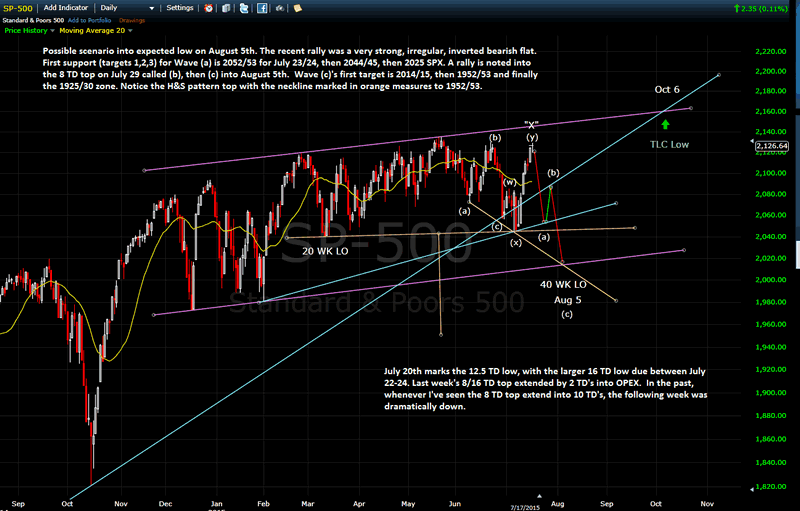
The daily chart shows what I expect at a minimum if the expectations don't work out. The August 5-6 date needs price to fall below 2015 SPX. The current H&S top suggests a minimum of 1952, but after the last H&S top in 2011, the market (SPX) fell to what is today around 1892. Measured today that may equate to around 1892 by early August.
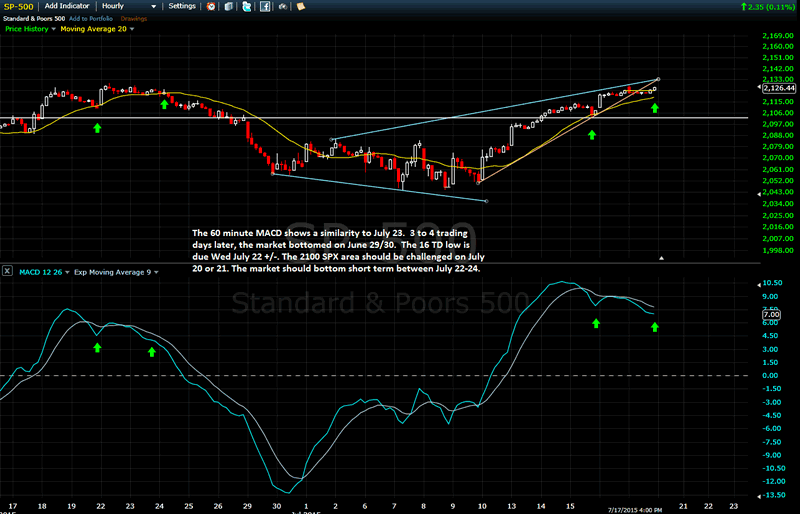
The hourly MACD chart shows a similarity to three weeks ago. If this pattern repeats, we should see a minor low on July 23-24 (2025/32 max; to 2044/45 mid; to 2052/53 min), but this time followed by a strong rally into the FED meeting (July 29 or maybe 30) and then down hard into around August 5/6. This would complete Wave A from the late May top (a double three).
S&P500 Weekly Chart
S&P500 Daily Chart
S&P500 Hourly Chart
Our subs caught the gold drop on Friday by buying DUST (3X Bear Direxion Gold Mining ETF) the day before and made 10% in one day. This is the power of diversification. Gold dropped below its previous bottom Wednesday and Thursday setting up the large decline into Friday. Monday may be a short term bottom and reversal day for a test of broken support by Wednesday. This complex is getting nearly washed out to the downside in the intermediate term, but likely has more selling due into early August.
Brad Gudgeon
Editor of The BluStar Market Timer
The BluStar Market Timer was rated #1 in the world by Timer Trac in 2014, competing with over 1600 market timers. This occurred despite what the author considered a very difficult year for him. Brad Gudgeon, editor and author of the BluStar Market Timer, is a market veteran of over 30 years. The website is www.blustarmarkettimer.info To view the details more clearly, you may visit our free chart look at www.blustarcharts.weebly.com Copyright 2015. All Rights Reserved
Copyright 2015, BluStar Market Timer. All rights reserved.
Disclaimer: The above information is not intended as investment advice. Market timers can and do make mistakes. The above analysis is believed to be reliable, but we cannot be responsible for losses should they occur as a result of using this information. This article is intended for educational purposes only. Past performance is never a guarantee of future performance.
Brad Gudgeon Archive |
© 2005-2022 http://www.MarketOracle.co.uk - The Market Oracle is a FREE Daily Financial Markets Analysis & Forecasting online publication.