The Gold - U.S. House Prices Ratio As A Valuation Indicator
Housing-Market / US Housing Jul 29, 2015 - 10:40 AM GMTBy: Dan_Amerman
 The Gold/Housing ratio is a quite useful measure for evaluating relative values between real estate and gold, and also has an interesting historical track record for identifying turning points in long-term gold price trends. In light of the commodities rout occurring in the summer of 2015, and the continuing strength in housing – it is worthwhile revisiting this basic measure, because the results aren't at all what most people likely think they are.
The graph below shows the Gold/Housing ratio for the modern era in the United States, from when gold investment was legalized on December 31, 1974 through November of 2011. When analyzed at that time (link here), the ratio clearly showed an historic outlier was being reached in terms of gold being expensive relative to real estate.
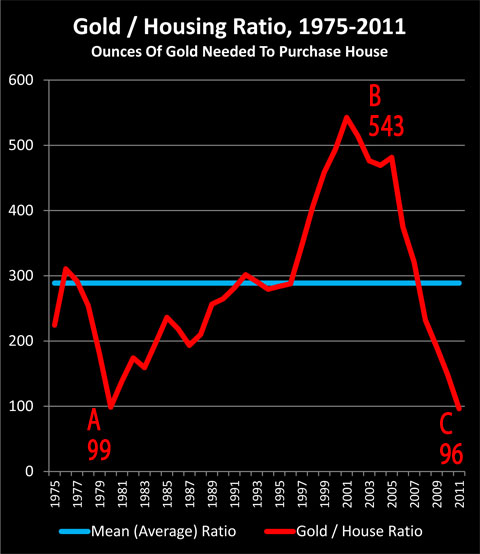
To place this in perspective, late 2011 was a time when "everyone knew" gold was a great investment that had been performing spectacularly for years, climbing to over $1,900 an ounce – while at the same time "everyone knew" real estate was a lousy investment that had been falling in value for years with no bottom in sight. But yet, the overwhelming consensus at that time notwithstanding, history would indeed have its own way, and within months the relationship would powerfully reverse in a way that has persisted to this day.
The information provided by the Gold/Housing ratio in 2015 is not as extreme an outlier as it was in 2011, but it is nonetheless compelling – and may be surprising. Indeed, this long-term measure flat-out contradicts many widely held perceptions about market valuations today.
Understanding The Gold/Housing Ratio
The Gold/Housing ratio is a measure of relative value between gold and real estate. It is the number of ounces of gold required to purchase an average single family home in the United States.
When we take the $221,314 current median national price for an existing single family home and divide it by the $1,089 price per ounce of gold as of July 22, 2015, we come up with a Gold/Housing ratio of 203, meaning it takes 203 ounces of gold to purchase an average single family home.
Now people often buy gold and real estate as alternative investments, either because they are seeking fundamental diversification from financial assets such as stocks and bonds, or they are concerned about inflation.
However, while real estate and gold are each tangible assets and can be powerful inflation hedges – they don't tend to move together in real terms.
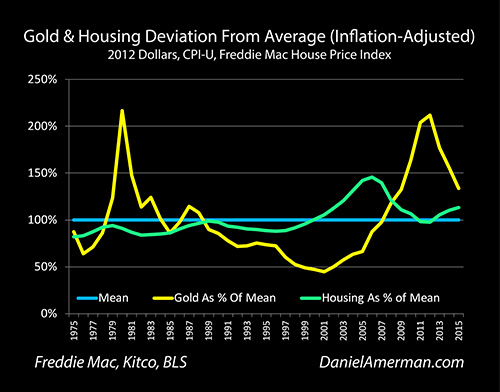
This can be clearly seen when we adjust historical prices for inflation, as shown above. Both investments do oscillate up and down around long term averages over the 40 years, but they so in quite different cycles, with their peaks and valleys occurring in different years.
Now if you can buy gold "cheap" while real estate is relatively "expensive", then on an asset price basis over the long term, gold is likely to strongly outperform real estate as an investment, all else being equal.
Conversely, when real estate is "cheap" and gold is "expensive" relative to its long-term averages, then it is real estate that is likely to powerfully outperform gold as an investment over the long term.
But what exactly is "cheap" and what is "expensive"? Answering that question is where the Gold/Housing ratio is quite useful. As there is no dollar component in the ratio itself, inflation index and measurement concerns drop out, and we are left with the value of two of the most popular tangible investments relative to each other.
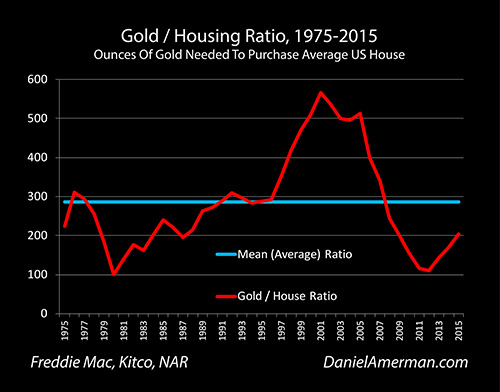
The long-term average is represented by the blue line in the above graphic. Over the 40 years that gold has been a legal investment in the modern United States, it has taken an average of 286 ounces of gold to purchase an average single family home, meaning the current price of 203 ounces is equal to 71% of the long term average.
There have been three major turning points in the valuation relationship between gold and real estate over those years.
The first turning point occurred at the peak of financial crisis in 1980, when it took only 100 ounces of gold to buy a house (on an annual average basis). Real estate was remarkably cheap relative to gold – and real estate investments would outperform gold by a huge margin over the next 21 years to come.
The second turning point occurred in 2001, with the Gold/Housing ratio reaching a high of 565 ounces of gold being needed to buy a single family home. Gold was remarkably cheap relative to real estate – and it was then gold asset prices that would outperform real estate asset prices by a huge margin over the next 11 years.
On an annual average basis, the third turning point occurred in 2012, when 110 ounces of gold was enough to purchase an average single family home. Real estate was once again remarkably cheap when compared to gold, and real estate has powerfully outperformed gold in the years since that time.
(See the Methodology Notes (linked here) for more information on data sources, calculation methodology and why an annual retroactive shift in the geographic weighting for the Freddie Mac House Price Index has created historical Gold/Housing ratios that are slightly different in the 2015 analysis than they were in the 2011 analysis.)
1980 & Gold As Investment
This next graph shows the average annual price of gold in inflation-adjusted (CPI-U) terms between when investing in gold bullion was legalized in the United States on December 31, 1974, and July 22, 2015. The blue line is the average price of gold over that period, which is $787 in 2012 dollars. The yellow line is the average annual price of gold during each year (except for 2015, where it is the value as of July 22).
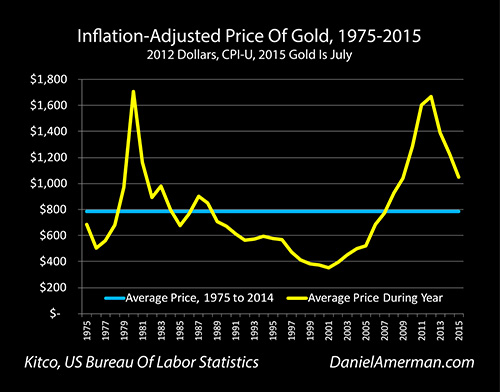
It is worthwhile to consider the situation in 1980. Inflation was soaring. Unemployment was high. An economic "malaise" gripped the nation, and pessimism about the future of the United States economy was rampant. The stock market was moving between flat and down. The real estate market was in terrible shape.
The one glittering exception was gold, which was soaring upwards in a spectacular bull market and reaching unprecedented levels – and which many people believed would only be a beginning point, as the dollar continued to fall and the economy continued to worsen.
However, from that point forward – gold did not perform or meet expectations. In nominal dollar terms – not adjusting for inflation – the average price of gold fell from $613 in 1980 to $271 in 2001, for a loss of 56%.
What is worse is that although the popular theory was that gold would be the perfect inflation hedge, in practice over the long term, gold failed spectacularly as an inflation hedge – at least from the perspective of gold purchased in the three peak years of 1979-1981. The inflation didn't stop after 1980 – indeed, the official rate of inflation in 1981 was 10.5%, the third highest rate of the modern era in the US – but gold investors still lost 32% in that first year after the peak in inflation-adjusted terms. Gold gave up all of its gains relative to its long term modern average of $787 per ounce by 1985, just five years after its peak.
Between 1980 and 2001, the time of the next Gold/Housing inflection point, the dollar would lose half of its value to inflation. Gold did not keep up, however, collapsing from $1,706 down to $351 per ounce (2012 dollars) over 21 years as it lost 80% of its value in inflation-adjusted terms.
(It should be noted that the $787 per ounce modern era average price is based on a relatively short 40 year period of time, which included a purely paper US dollar and two major crises, and is itself unusually high by long term standards. As an example of a longer term, multi-century measurement, gold averaged $458 an ounce (in 2009 dollars) between 1791 and 2009, although inflation measures grow increasingly unreliable the farther back in time one goes.)
1980 & Real Estate As Investment
The graph below shows the average price of a single family home in the United States between 1975 and the first quarter of 2015. The trend is strongly upwards, and when viewed from this common perspective, home prices are clearly nearing their long-term peak. Indeed, it is easy to see why some are concerned that we have experienced a return to bubble pricing, because current prices are so far above most historical prices.
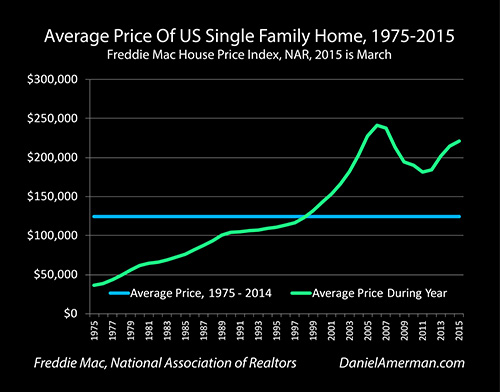
The problem is that the picture that is commonly presented for the long-term is completely inaccurate as an indicator of changes in real value (something gold and stock returns as commonly presented also share). For what is primarily illustrated is not changes in real estate values – but the declining purchasing power of the dollar, as what cost $1 in 1975 costs $4.42 today, if we accept the Consumer Price Index as being an accurate inflation measure.
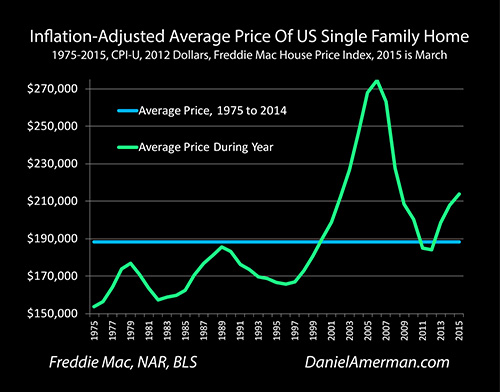
When we adjust housing prices for the 77% decline in the purchasing power of the US dollar between 1975 and 2015, then we get the quite different graphic below. This shows the average price of a single family home in inflation-adjusted (CPI-U) terms from 1975 through the first quarter of 2015, with a mean (average) price of $213,695 in 2012 dollars.
In the mind of the general public in 1980, real estate was a total "dog" of an investment and had been so for years. To the extent that some people were turning down promotions if they involved a move, because the raise associated with the promotion often wasn't high enough to offset the radically higher mortgage payments. Many people who would have ordinarily bought homes were renting instead, fearful of how much lower the value might be when they tried to sell. The combination of recession, high unemployment and inflation-induced high interest rates had created a moribund real estate market, with low sales and greatly reduced new home construction.
These highly negative market conditions created a pricing situation in which real estate was only being valued at 35% of its long-term average value relative to gold, meaning real estate was extremely "cheap" in comparison – and ready to move the other way.
Indeed, from this base of near universal disdain came a remarkably healthy and sustained long-term environment for building wealth via buying investment real estate. Using single family homes as a proxy (investment real estate overlaps, but is not the same thing), the average price for a single family home in the United States rose every year for the next 21 years from $61,338 to $153,270 (no inflation adjustment). This 150% increase took place by 2001, and therefore did not include any benefit from the housing bubble.
Inflation was the largest component of this rise, and unlike gold, housing performed as a powerful inflation hedge for the next two decades. Even after adjusting for inflation, during the same period that gold fell 80%, housing rose from $170,914 to $198,706, an increase of 16%. (The decline shown from 1980-1982 in the graph does not exist if we use nominal dollars, which is the norm – it only appears when we adjust for inflation.)
If we take the long term perspective of real estate investments generating steady performance, where cash flows increase every year as rental payments coming in steadily rise relative to mortgage payments going out, even as equity increases every year as overall property prices steadily rise while the mortgage slowly falls – then the years between the turning points of 1980 and 2001 were a wonderful time to be a long term real estate investor. Sure, there were dips and rises and crises as happens with almost any investment category over the long term, but the years between 1980 and 2001 were a great time to accumulate wealth as a long-term real estate investor.
Referring back to the relationships underlying the Gold/Housing ratio, as each inflation hedge separately moved up and down around their long term averages, and as gold soared above its average while real estate fell (in inflation-adjusted terms), making it very cheap compared to gold – then we would expect real estate to radically outperform gold after that time. And indeed that is exactly what happened – in the 21 years following (1980-2001), real estate asset prices outperformed gold by 465%.
Gold & Real Estate In 2001
By 2001, the relationship between gold and real estate had entirely reversed, as the Gold/Housing ratio reached a historic high of 565 ounces of gold to buy an average home.
Gold was a total dog of an investment. Real estate was hot. The overwhelming market sentiment, and what most financially savvy people believed, was that real estate was a far superior investment to gold.
It was precisely this overwhelming consensus of opinion among intelligent, knowledgeable investors, and some of the most respected financial experts in the nation, which created the situation where real estate was very "expensive" relative to gold.
In contrast, if we take the long term perspective of relative value, with real estate far above its historic average value relative to gold (it took 565 ounces to buy a house in 2001), one would expect gold to then powerfully outperform housing. And that is exactly what happened over the following eleven years, from 2001 to 2012.
Over those next eleven years, gold would rise from $271 an ounce to $1,669 an ounce (annual average for 2012), even while real estate rose from $153,270 to $184,019 for an average single family home. Adjusting for inflation, gold rose from $351 an ounce to $1,669, while housing fell from $198,706 to $184,019.
This serves as yet another confirmation of the central premise of the Gold/Housing ratio, which is that if you can buy an inflation hedge "cheap", then over the long term you are likely to widely outperform an inflation hedge bought "expensive" – given that both gold and real estate move up and down around long-term average values.
Three For Three Correlation
Part II of this article explores 1) the 100% correlation over the last 40 years between Gold/Housing ratio outliers and long-term trend reversals with the price of gold; 2) the implications for investors preferring to follow price trends; 3) the implications for contrarian investors preferring to move against the "herd"; and 4) the proper use of the Gold/Housing ratio.
Daniel R. Amerman, CFAWebsite: http://danielamerman.com/
E-mail: mail@the-great-retirement-experiment.com
Daniel R. Amerman, Chartered Financial Analyst with MBA and BSBA degrees in finance, is a former investment banker who developed sophisticated new financial products for institutional investors (in the 1980s), and was the author of McGraw-Hill's lead reference book on mortgage derivatives in the mid-1990s. An outspoken critic of the conventional wisdom about long-term investing and retirement planning, Mr. Amerman has spent more than a decade creating a radically different set of individual investor solutions designed to prosper in an environment of economic turmoil, broken government promises, repressive government taxation and collapsing conventional retirement portfolios
© 2015 Copyright Dan Amerman - All Rights Reserved
Disclaimer: This article contains the ideas and opinions of the author. It is a conceptual exploration of financial and general economic principles. As with any financial discussion of the future, there cannot be any absolute certainty. What this article does not contain is specific investment, legal, tax or any other form of professional advice. If specific advice is needed, it should be sought from an appropriate professional. Any liability, responsibility or warranty for the results of the application of principles contained in the article, website, readings, videos, DVDs, books and related materials, either directly or indirectly, are expressly disclaimed by the author.
© 2005-2022 http://www.MarketOracle.co.uk - The Market Oracle is a FREE Daily Financial Markets Analysis & Forecasting online publication.


