


Agricultural Commodities Prices Prepare To Launch Higher Again
Commodities / Agricultural Commodities Aug 09, 2015 - 08:59 AM GMTBy: Austin_Galt

 As outlined in previous analysis, the price of the agricultural commodities of corn, soybeans and wheat look to have already kicked off the bear rallies. From previous longer term analysis, we are expecting these bear rallies to be big ones.
Prices have come back down and now look ready to launch into the next stage of these rallies so let's revise the technicals of each commodity using the daily charts.
Corn Daily Chart
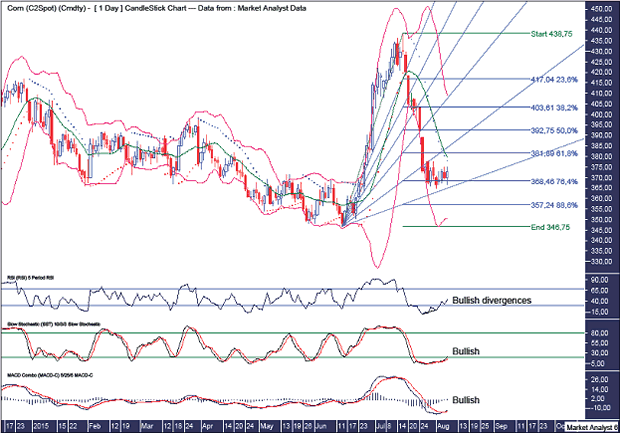
The first correction in a new bull trend often makes a deep retracement and so far price has already pulled back to around the 76.4% Fibonacci retracement level of the first move higher.
I have drawn a Fibonacci Fan which shows the recent low just above the 88.6% angle which often sees in the first pullback low.
The PSAR indicator still has a bearish bias with the dots above price.
The Bollinger Bands show price has left the lower band but has yet to get back to the middle band so one final move back to the lower band remains a possibility.
The recent low was accompanied by bullish divergences on the RSI while both the Stochatsic and MACD indicators have now turned bullish.
Soybeans Daily Chart
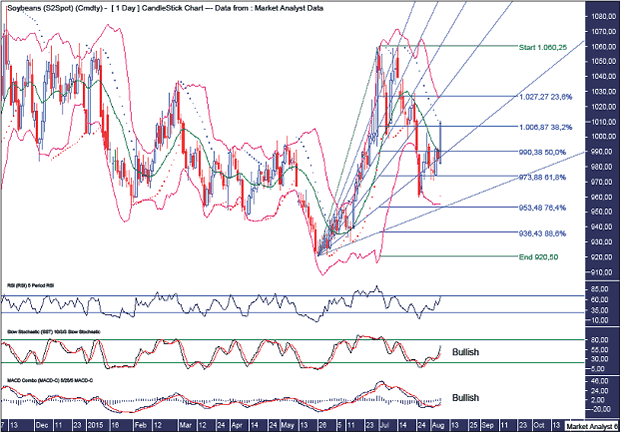
Price has corrected to just above the 76.4% Fibonacci retracement level and while the 76.4% Fibonacci Fan angle looks to have provided support. While price turning back up now looks bullish, a move back to the 76.4% retracement level and 88.6% fan angle can't be ruled out.
The PSAR indicator now has a bullish bias with the dots below price although it would not surprise to see price come back down to test the support from these dots which are near the recent lows.
The Bollinger Bands show price now just above the middle band and I would expect some oscillation around this middle band at the least before the next leg higher really gets going.
The RSI did not show any bullish divergence at the recent low which I generally like to see although it is certainly not necessary. The Stochastic and MACD indicators are both now bullish again.
Wheat Daily Chart
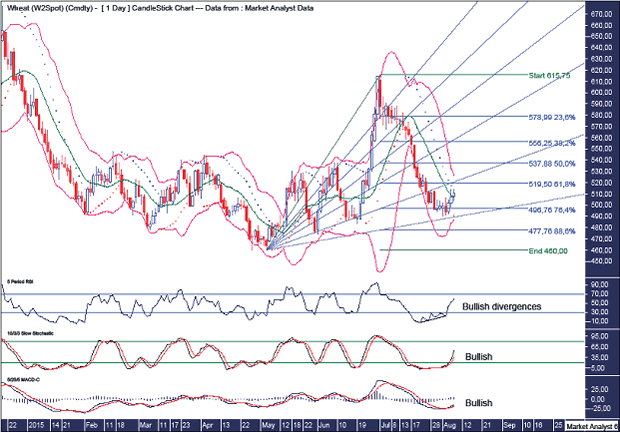
Price has corrected to around the 76.4% Fibonacci retracement level and the 88.6% Fibonacci Fan angle and if the low is not yet in place then I would expect any further moves lower to be only very marginal.
The PSAR indicator now has a bullish bias with the dots below price.
The Bollinger bands show price is back to the middle band but it is not uncommon in these instances to see one last hurrah move back to the lower band before the rally really lets loose.
The recent low showed bullish divergences on the RSI while the Stochastic and MACD indicators have both turned bullish.
Summing up, the prices of corn, soybeans and wheat have all now made deep retracements which are commonly found at the beginning of new bull trend. We should see a test of these recent lows which may or may not make marginal false break lows before the expected bear rallies kick on to much higher prices.
By Austin Galt
Austin Galt is The Voodoo Analyst. I have studied charts for over 20 years and am currently a private trader. Several years ago I worked as a licensed advisor with a well known Australian stock broker. While there was an abundance of fundamental analysts, there seemed to be a dearth of technical analysts. My aim here is to provide my view of technical analysis that is both intriguing and misunderstood by many. I like to refer to it as the black magic of stock market analysis.
Email - info@thevoodooanalyst.com
© 2015 Copyright The Voodoo Analyst - All Rights Reserved
Disclaimer: The above is a matter of opinion provided for general information purposes only and is not intended as investment advice. Information and analysis above are derived from sources and utilising methods believed to be reliable, but we cannot accept responsibility for any losses you may incur as a result of this analysis. Individuals should consult with their personal financial advisors.
Austin Galt Archive |
© 2005-2022 http://www.MarketOracle.co.uk - The Market Oracle is a FREE Daily Financial Markets Analysis & Forecasting online publication.