


Stock Market Crash, Bear Market Rally in Gold?
Stock-Markets / Financial Markets 2015 Aug 10, 2015 - 10:05 AM GMTBy: Brad_Gudgeon

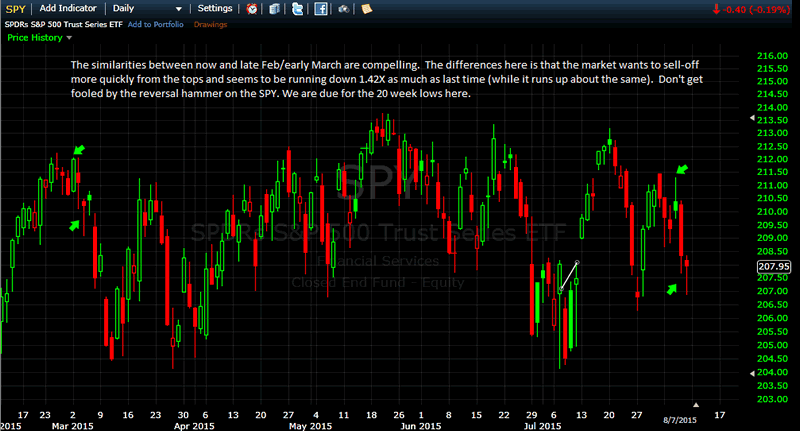
 I'm attaching three charts today: One chart of the daily SPY shows the parallel between Friday and March 3, 2015. The next one, shows where it could go as far as price and time is concerned, and the third shows the weekly chart of the SPX and what I believe may be the eventual conclusion of the correction into October of this year.
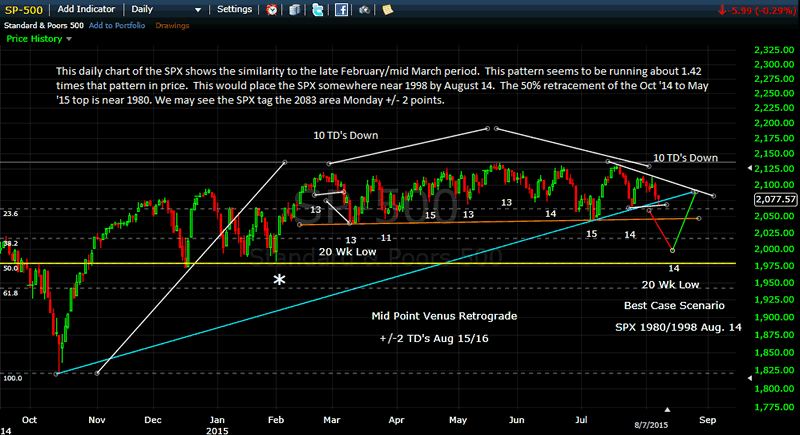
Astro-cycle-wise, we have not yet seen the 100 TD low, commonly called the 20 week low, last seen on March 11, 2015. As of Friday we are at TD 104. The 100 TD low usually comes within about a 10% variance giving it about 10 TD's on either side (the longest I've seen was at about 115/116 TD's ).
As far as the astro is concerned, Venus retrograde is the key timer for a reversal low in this time-frame. Our next opportunity for a major low is mid-retrograde which lies 2 trading days max on either side of Aug 15/16 (this next weekend). August 14th is the new moon. July 31 was the full moon. August 14 is exactly 10 trading days from July 31: just like March 11 was10 trading days from February 26. (I also include a pattern of 13 TD lows 2 TD's since early February on one of the charts).
Back in late Feb/early March the SPX made a similar topping pattern to what just happened from July 31 - August 5. Back then the NASDAQ and Dow tagged new highs on the third day, but the SPX failed by 2 points. Now we have the NASDAQ, but not the Dow making new highs three day after the initial SPX top. In fact, the Dow Indu is not even close, breaking down under the 200 day moving average and about to signal a 'death cross' of the 50 day moving average below the 200 day moving average. The SPX looks like it may soon the follow the lead of the Industrials.
Here again, we have the SPX failing to make new highs by 2 points last Wednesday, just like March 3. The major difference this time is the % sell-off of the down moves, which are running about 1.42 times the last run down to the 20 week low in March.
All things remaining the same, we should see a possible move to the 2083 area 2 points Monday and then drop into the upper 2020's or low 2030's by Tuesday followed by a 16/17 point up move into Wednesday (the 8/16+1 TD top) to test the bottom of the neckline of the recent head and shoulders top. The move from Wednesday next week into Friday should be the largest move and that could go to 1998 or even lower depending on how far down Tuesday goes (remember I have a TLC low due Tuesday). The Friday low should be Gann 4+1/0-z2 TD low joining the Hurst low of (12.5) 13 TD's +1 on the new moon.
Solunar CIT's (changes in trend) are due Tuesday and Friday next week, with the last one due Friday August 7 (which was a 4/8+1 low). Following the yellow brick road, the next important top should come on August 26 near 2088, which should be the 5 week top (+2). There should be a double bottom on August 18.
I will be making updates (with more exact changes) as events unfold. The bottom line is I expect a move down to tag the general 2000 SPX level (at the very least) by Friday next week.
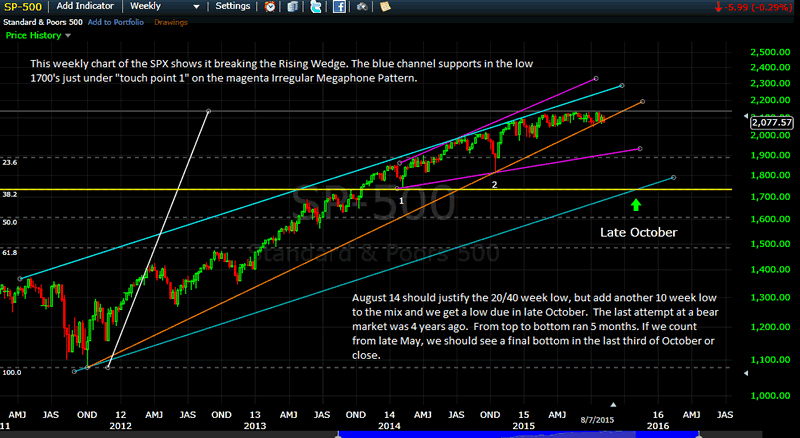
What makes the coming sell-off next week possibly unusual, is that normally the 20/40 week low is the dominant low coming off of a previous low like October 15, 2014. This expected sell-off next week would surprise me if we ran much lower than 1998/2004 on the SPX. The head and shoulders/distribution pattern top gives me a 1952 SPX target on the down side, but these have not been working well lately.
The bottom of the Irregular Megaphone Pattern (IMP) shows support near 1924/25 this coming Friday. The cycle looks right, now it remains to be seen how low we go.
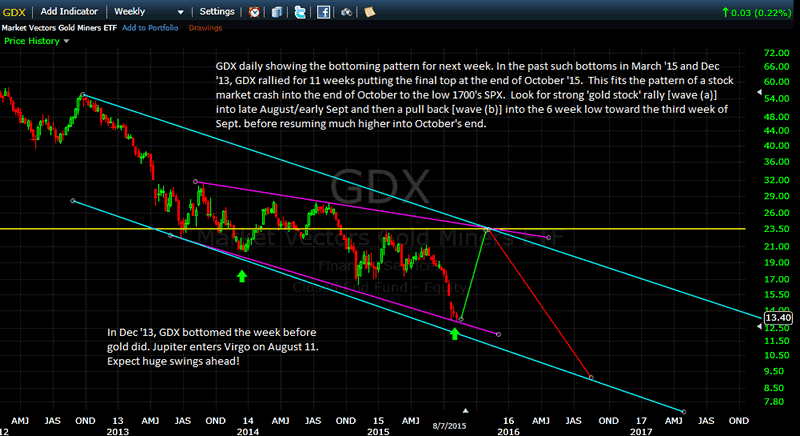
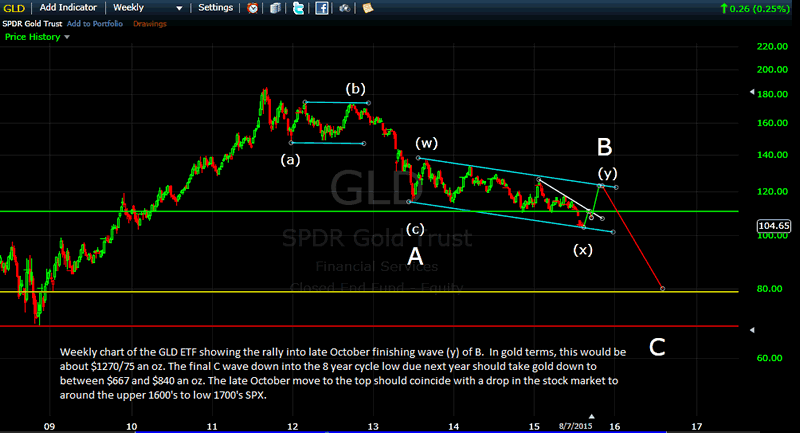
The expected minor drop in the stock market (to the expected SPX 1998/2004 zone) next week should not have a profound effect on the gold stocks or gold other than perhaps keeping the lid on a break out. As noted before, the current short positions in gold are unprecedented and unsustainable, which guarantees a huge rally into the end of October to near $1270-1275 the oz. This should occur at the same the stock market crashes to near 1700 SPX.
In the past, when we had a similar condition (Dec '13), GDX bottomed a week before gold did. Gold looks to bottom on August 14/17 near the Gann low and also the midpoint of Venus retrograde. GDX could bottom again as early as August 11 upon Jupiter entering Virgo or as late as August 14 or it may have already seen its low.
The MACD (daily and 4 hr) are on buy signals for both GLD and GDX. The weekly chart shows the current trend channel which suggests not much lower prices are possible for gold as many are thinking.
The next rally top is due around Sept 1 for both GDX and GLD and that should be near $1150 an ounce. Around the third week of SEPT, gold should begin the 'c' wave of (y) or the strongest part of the expected move up, which should probably coincide with a steep drop in the stock market. It may be triggered by a FED announcement to raise rates.
The mining sector has overreacted to the move in gold so much so, that we are approaching levels not seen since 2001 when gold was barely above $300. Based on the current trajectory down, we are 21% below the price of gold and hence "stretched" and due for a rubber band rebound that should get GDX back to near normal for $1270 an ounce and that should be somewhere near $23/$24.
This kind of move should take NUGT to at least around the $8 or $9 level minimum. The first move into September should take GDX up about 25%, which should take NUGT up to near the low $5 area.
The BluStar Market Timer was rated #1 in the world by Timer Trac in 2014 (and from April 1, 2014 through March 31, 2015), competing with over 600 market timers. This occurred despite what the author considered to be (and still considers to be) a very difficult trading environment.
The BluStar Market Timer also now offers auto-trading and timely signals trading the Direxion BULL/BEAR 3X ETF and Precious Metals ETF's such as AGQ, ZSL, NUGT and DUST.
Brad Gudgeon
Editor of The BluStar Market Timer
The BluStar Market Timer was rated #1 in the world by Timer Trac in 2014, competing with over 1600 market timers. This occurred despite what the author considered a very difficult year for him. Brad Gudgeon, editor and author of the BluStar Market Timer, is a market veteran of over 30 years. The website is www.blustarmarkettimer.info To view the details more clearly, you may visit our free chart look at www.blustarcharts.weebly.com Copyright 2015. All Rights Reserved
Copyright 2015, BluStar Market Timer. All rights reserved.
Disclaimer: The above information is not intended as investment advice. Market timers can and do make mistakes. The above analysis is believed to be reliable, but we cannot be responsible for losses should they occur as a result of using this information. This article is intended for educational purposes only. Past performance is never a guarantee of future performance.
Brad Gudgeon Archive |
© 2005-2022 http://www.MarketOracle.co.uk - The Market Oracle is a FREE Daily Financial Markets Analysis & Forecasting online publication.