


Next Stock Market Low Important
Stock-Markets / Stock Markets 2015 Aug 16, 2015 - 09:02 AM GMTBy: Tony_Caldaro

 The market started the week at SPX 2078. After a gap up opening on Monday the SPX rallied to 2105. Then two gap down openings took it down to 2052 by Wednesday. After that the market worked its back up above where it started the week, and ended the week at SPX 2092. For the week the SPX/DOW were +0.65%, the NDX/NAZ were +0.15%, and the DJ World lost 0.40%. On the economic front positive reports slightly outpaced negative reports. On the uptick: wholesale/business inventories, retail sales, the PPI, industrial production, capacity utilization, and long term investor sentiment. On the downtick: export/import prices, consumer sentiment, plus both weekly jobless claims and the treasury deficit increased. Next week will be highlighted by the FOMC minutes, the NY/Philly FED, and Leading indicators.
LONG TERM: bull market
Over the past 100 years there have been 15 bull markets. Eighty percent of these have lasted for five years or less. Only three have lasted longer than five years: 1921-1929, 1987-2000, and 2009-present. Eighty-seven percent of the time these bull markets have been relatively easy to track, label, and anticipate their conclusions using quantified waves. Of the two that were difficult, 1987-2000 and 2009-present, only the third wave of those bull markets were hard to track. Waves one and five, in both, were relatively easy. So we are currently dealing with a situation that has only occurred twice in the past 100 years.
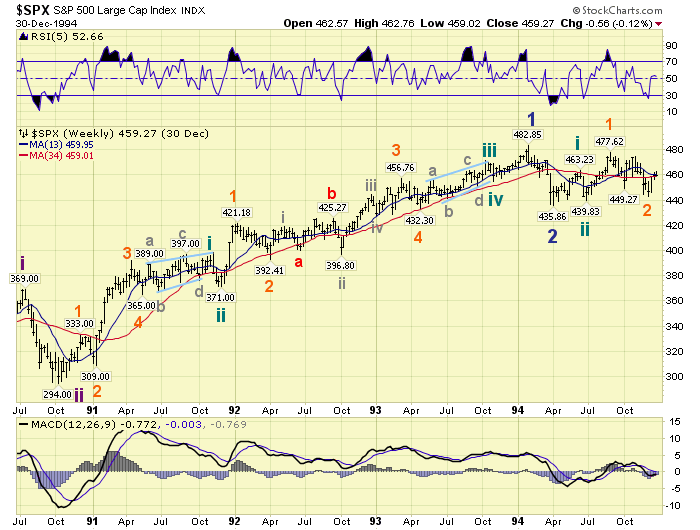
When we review each of the 15 bull markets we find that none of the three rising legs, waves 1, 3 and 5, lasted more than three years with two exceptions. The exceptions are the third wave of the 1987-2000 bull market: 1990-1998, and the third wave of the current bull market: 2011-present. Last weekend we posted a chart, with labeling, of the 1990-1994 period. We repeat it here. Notice that many, many of the uptrends were overlapped by the following downtrend. Then notice, when that third wave entered its fourth year the market went sideways for the entire year. Then from 1995-1998 the overlaps were basically gone, as the bull market resumed.
When we review the DOW’s wave pattern since 2011. We find that only one of its uptrends was not overlapped by a subsequent downtrend. If we were just tracking the DOW it would be impossible to follow this type of pattern. But since we are following many, many indices it has been difficult but not impossible. One could conclude that rising legs of a bull market run into difficulty when they reach four years in duration. This might explain why it has only occurred twice in 100 years.
To remain on track during this difficult period, the market requires one to use all the technical information available and then arrive at potential counts that would fit market activity. Keep in mind, these rare exceptions only occur within third waves of bull markets. Not during the first wave, nor the fifth wave.
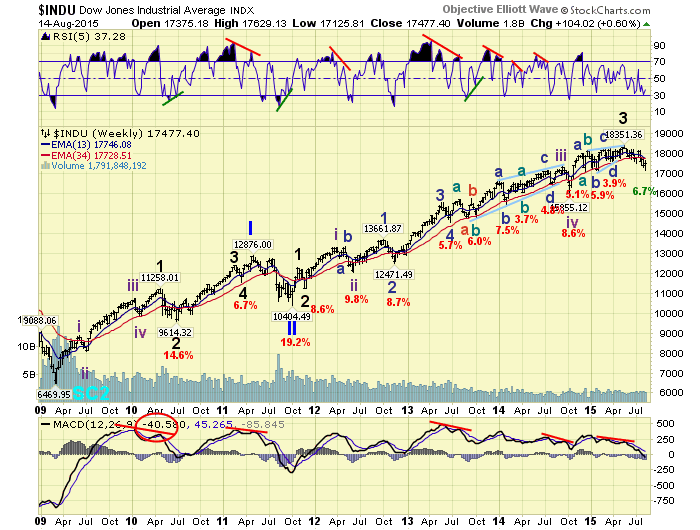
For most of the year our primary count has been Major wave 5 of Primary III was subdividing into five Intermediate waves. About a month ago we noticed some deterioration in our long term indicators, which has since improved, and introduced a Primary III completed count. Initially we gave both these counts a 50/50 probability, but lowered the P III done count to 40% after the indicators improved. During this week we uncovered a third potential count. You might have noticed it in the DOW chart above: Major wave 4 of Primary III currently underway. We will detail the rationale behind this count in the next section.
MEDIUM TERM
Ever since the DOW made all time new high in mid-2013 it has been struggling to move higher. Since that point in time every uptrend has been overlapped by the following downtrend, while the SPX and NDX/NAZ have impulse higher. Historically, this is nothing unusual and occurs from time to time. The DOW, for example, was the leader in the 1980’s and 1990’s, until 1998. The DOW also struggled midway through the 2002-2007 bull market before catching up in the last two years. Now again the DOW has been struggling midway through this bull market.
What is interesting to note, is while the SPX/NDX/NAZ were impulsing higher from Q3 2013 until Q3 2014 the DOW formed a diagonal triangle. Then all four indices topped together to end Intermediate wave iii of Major wave 3. The Intermediate wave iv correction that followed was the largest correction, in all four indices, since 2012. After that ended they all started uptrending in Intermediate wave v. After that October 2014 low the DOW went right back to its previous overlapping pattern, and could have completed another diagonal at its May 2015 all time high. It has been in a downtrend ever since that high.
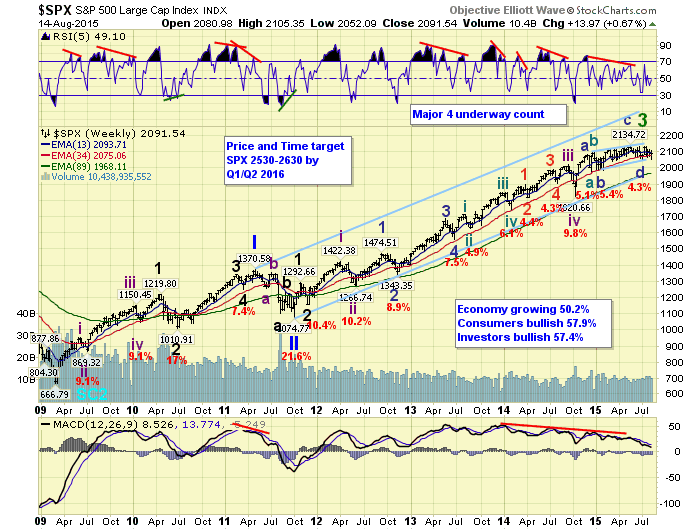
If one then removes the labels in the SPX from the October 2014 low we can observe a similar, but somewhat different, overlapping pattern. The SPX rose from that low into December, made an irregular flat into February, then has an uptrend which took the form of diagonal into May. After that, the downtrend that followed overlapped the December high. Then recently the SPX had a new uptrend into July. All this activity could be counted as an Intermediate wave v diagonal triangle, just like the DOW count. Wave a 2079, wave b 1981, wave c 2135, wave d 2044, wave e 2133.
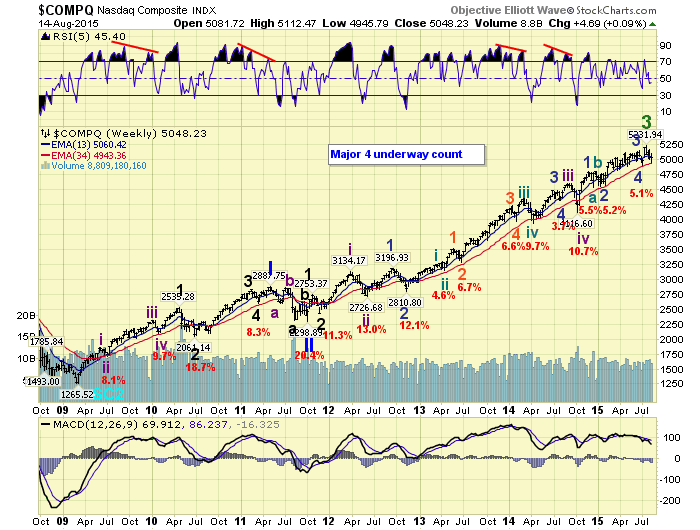
In the meantime the leading NDX/NAZ could have completed five impulse waves up from their October 2014 low to complete a more orthodox Intermediate wave v. So we now have three potential counts in this ever extending Primary III leg of the five primary wave bull market. This analysis would suggest the consistent weakness in the DOW has recently impacted the SPX, while the NDX/NAZ have basically driven the market higher. The growth indices, in a low growth economy, continuing to support the cyclical indices.
While having to deal with three potential counts may be somewhat confusing, all three suggest the market should make an important low once a downtrend is confirmed and it ends. The Intermediate wave ii count, posted on the SPX hourly chart, suggests a downtrend low right around the low SPX 2040’s. The Major wave 4 count, posted on the SPX weekly chart, suggests a downtrend low right around the 2019 pivot. The Primary IV count, posted on the SPX daily charts, suggests a downtrend low around SPX 1820. Currently we continue to prefer the Intermediate wave ii count, and give the probabilities of 40/30/30 for the three. Medium term support is at the SPX 2085 and 2070 pivots, with resistance at the 2131 and 2198 pivots.
SHORT TERM
Reviewing the recent activity over the past few months we continue to track it in relationship to the preferred Intermediate wave i-ii count. We labeled the SPX 2135 all time high as Int. wave i. Then the SPX did an a-b-c down to 2044 to end Minor wave a of Int. wave ii. The uptrend that followed was also three waves and peaked at SPX 2133 in July. This is labeled Minor wave b of Int. wave ii. The activity since that high has been fairly choppy and appears to be Minor wave c of Int. wave ii.
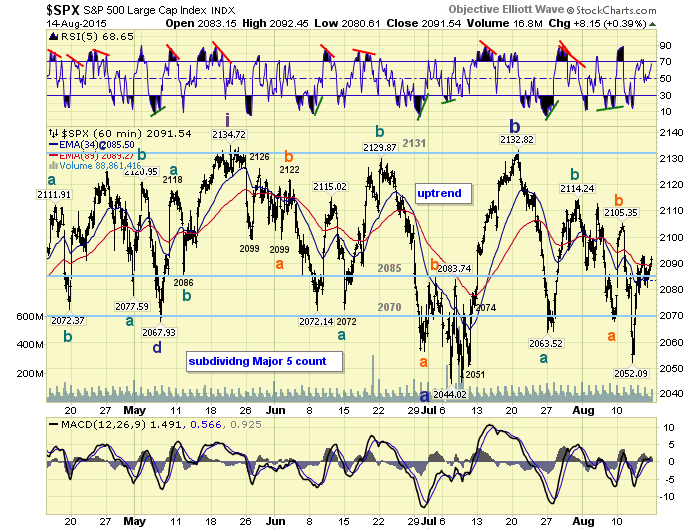
We have labeled this decline as Minute a at SPX 2064, and Minute b at SPX 2114, with Minute c underway. While Minute a was a simple three waves, Minute c has been quite complex. During Minor wave a, Minute a was complex and Minute c was simple. If Minute c (2114-xxxx) equals Minute a (2133-2064), then it should end at SPX 2045. If Minor c (2133-xxxx) equals Minor a (2135-2044), then it should end at SPX 2042. Both wave relationships suggest a low in the lower SPX 2040’s.
If the SPX drops below the 2040’s to the 2019 pivot range, then the decline is probably Major wave 4. If the SPX drops below the 2019 pivot to the 1973 pivot, then the decline is probably Primary IV. While the SPX is still currently within 2% of its all time high, there has been plenty of time to take defensive positions. Short term support is at the 2085 and 2070 pivots, with resistance at SPX 2114 and the 2131 pivot. Short term momentum ended the week just under overbought. Best to your trading!
FOREIGN MARKETS
Asian markets were mostly lower for the week for 1.1% net loss.
European markets were all lower on the week for a 2.6% net loss.
The Commodity equity group were mostly lower for a 0.7% net loss.
The DJ World index is still in a downtrend and lost 0.4%.
COMMODITIES
Bonds are in an uptrend but lost 0.1% on the week.
Crude is still in a downtrend and lost 1.5% on the week.
Gold is trying to uptrend and gained 1.8% on the week.
The USD may be in a downtrend and lost 1.0% on the week.
NEXT WEEK
Monday: the NY FED at 8:30, then NAHB housing at 10am. Tuesday: Housing starts and Building permits. Wednesday: the CPI and the FOMC minutes. Thursday: weekly Jobless claims, Existing home sales, the Philly FED and Leading indicators. Friday: Options expiration. Best to your weekend and week!
CHARTS: http://stockcharts.com/public/1269446/tenpp
After about 40 years of investing in the markets one learns that the markets are constantly changing, not only in price, but in what drives the markets. In the 1960s, the Nifty Fifty were the leaders of the stock market. In the 1970s, stock selection using Technical Analysis was important, as the market stayed with a trading range for the entire decade. In the 1980s, the market finally broke out of it doldrums, as the DOW broke through 1100 in 1982, and launched the greatest bull market on record.
Sharing is an important aspect of a life. Over 100 people have joined our group, from all walks of life, covering twenty three countries across the globe. It's been the most fun I have ever had in the market. Sharing uncommon knowledge, with investors. In hope of aiding them in finding their financial independence.
Copyright © 2015 Tony Caldaro - All Rights Reserved Disclaimer: The above is a matter of opinion provided for general information purposes only and is not intended as investment advice. Information and analysis above are derived from sources and utilising methods believed to be reliable, but we cannot accept responsibility for any losses you may incur as a result of this analysis. Individuals should consult with their personal financial advisors.
Tony Caldaro Archive |
© 2005-2022 http://www.MarketOracle.co.uk - The Market Oracle is a FREE Daily Financial Markets Analysis & Forecasting online publication.