


The Coming Silver Price Rally Will Outperform All Previous Ones
Commodities / Gold and Silver 2015 Aug 17, 2015 - 06:52 PM GMTBy: Hubert_Moolman

 The Gold/Silver Ratio (GSR) is a key indicator in the analysis of the silver and gold markets. This ratio (or chart of the ratio) is probably one of the most difficult to analyse. One has to take a real close look at the ratio in order to find what actually drives the ratio up or down.
For example, from about after the end of the Second World War to the early 70s there was an economic boom with the Dow rallying significantly during those years. During the same period the GSR actually kept falling significantly until it actually bottomed in 1968.
From 1980, after the economic contraction of the 70s, we again had an economic boom with the Dow rising significantly until 1999. During this same period the GSR actually rose aggressively until its peak in 1991. Exactly, the complete opposite to what happened during the 40s to early 70s boom. So, the cycle for the GSR is definitely not fixed, relative to economic output or the Dow, for example; and this is one of the reasons why it can be difficult to analyse.
The Dow kept on rising after 1991 to 1999, while the GSR actually fell during the same period. This makes it even more confusing.
The basis for understanding the GSR and where it is going, lies in the understanding of how the debt-based monetary system and demonetization has affected gold and silver over the last 140 years. Below, is a chart I did some time ago for my long-term silver fractal analysis report, which goes a long way in explaining this:
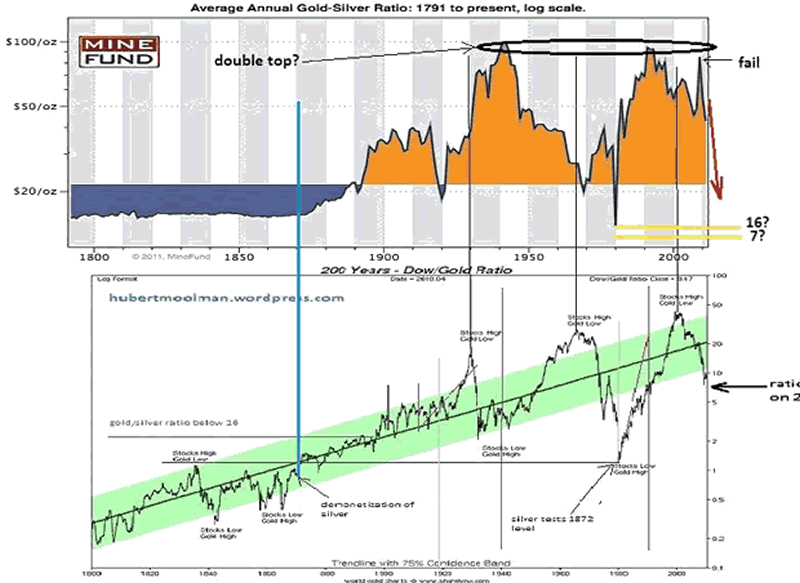
The top chart is from minefund.com, and features the gold-silver ratio from 1791 to present. The bottom chart is from sharelynx.com, and features the Dow-gold ratio from 1800 to present. Here we will only focus on the top chart. I have drawn a vertical blue line, approximately where silver was demonetized (1870s). Notice how the GSR started rising, becoming very volatile with three massive peaks eventually forming. When the debt-based monetary system is taken out of the way, then the GSR will eventually stabilise at pre - 1870s levels and lower.
Silver Rallies and the Gold Silver Ratio
In the last 100 years, there were three significant silver rallies, depending on how you look at it, with the current one still in progress. Below is a long-term Gold/Silver Ratio chart showing those silver rallies:
I have highlighted the periods during which the silver rallies occurred from bottom (B) to peak (P).
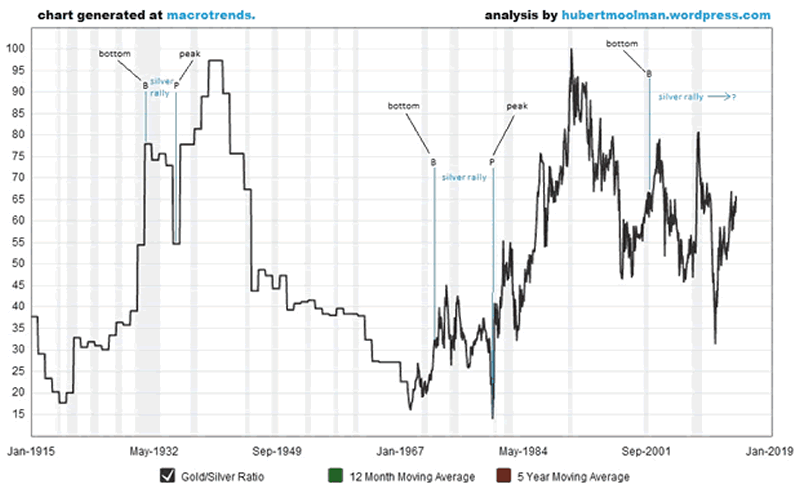
- The silver rally of the 30s started (measured from bottom) before the 1940s major peak of the GSR.
- The silver rally of the 70s started (measured from bottom) before the 1980 major bottom of the GSR.
- The current silver rally started (measured from bottom) after the 1991 major peak the GSR.
Although the three rallies have similarities (which I dealt with in a previous silver fractal analysis article), they are actually radically different, when you look at them relative to the GSR.
The 30s rally started early, since the demonetization of silver; and there would have still been a lot of silver in the market - those that should have been otherwise used as coinage, but were being melted down and sold in the open market, as country after country demonetized silver. The silver rally was not that strong because silver had not bottomed yet, in relation to gold.
The rally of the 70s started at a time when the demonetization process was well on its way, with most countries having already discontinued using silver in circulation coins, for example. However, the conditions were still not right for silver to return permanently to pre - 1870s levels.
One of the biggest obstacle to this was the fact that debt-levels relative to GDP were actually very low as compared to that of the 20s and 30s. Therefore, the debt-based monetary system was still well supported and able to continue despite a big demand for silver and gold. However, silver was still able to rally significantly, with the GSR eventually just touching pre-1870 levels for a very short time.
The current silver rally started at a much different and more favourable time as compared to the 70s rally. The biggest difference was the fact that this rally actually started after or closer to the GSR reaching an all-time high level (in terms of time and the ratio value) as supposed to before or closer to the GSR reaching a significant low (in terms of time and the ratio value), like in the 70s. Which means that silver was very undervalued as compared to gold (and still is), at the start of the current rally, so it has more room to go higher versus gold and fiat currency.
Although, the 30s rally started closer to the GSR reaching an all-time high level (in terms of time and the ratio value) - like currently; it was on the wrong side of the major peak. So, conditions appear to be a lot better for the current rally - much like cycling down a hill is compared to cycling up a hill.
Another big difference is the fact that current debt levels are much higher than that of the 70s and even the 30s, nominally as well as relative to GDP. This significantly weakens the position and foundations of the debt-based monetary system. Again, this means conditions for the current silver rally is much better, for its opposition is really weak as compared to the 70s and 30s (note that silver is in direct opposition to our monetary system).
Lastly, the significant length of time since the demonetization of silver, and the events during that time, shaped the silver market in such a manner that it is now in peak condition (inelastic supply, low quantities investment grade silver, being a small market relative to money supply, etc.) to reach higher values. The double top in the GSR chart as well as the double bottom on the long-term silver chart suggests this.
This sets silver up to exceed its 1930s and 1970s performance, by far. The last thing that needs to be removed (which now are being removed), is the headwinds caused by a rallying stock market.
Do not expect silver to equal or only just better its 1970s performance. That would be akin to a man who bullied a lion cub a few years earlier, expecting to do the same again to that now fully-grown lion.
Warm regards
For more of this kind of analysis on silver and gold, you are welcome to subscribe to my premium service. I have also recently completed a Long-term Silver Fractal Analysis Report.
"And it shall come to pass, that whosoever shall call on the name of the Lord shall be saved"
Hubert
http://hubertmoolman.wordpress.com/
You can email any comments to hubert@hgmandassociates.co.za
© 2015 Copyright Hubert Moolman - All Rights Reserved
Disclaimer: The above is a matter of opinion provided for general information purposes only and is not intended as investment advice. Information and analysis above are derived from sources and utilising methods believed to be reliable, but we cannot accept responsibility for any losses you may incur as a result of this analysis. Individuals should consult with their personal financial advisors.
© 2005-2022 http://www.MarketOracle.co.uk - The Market Oracle is a FREE Daily Financial Markets Analysis & Forecasting online publication.