Gold Golden Opportunity or Gold-Plated Trap?
Commodities / Gold and Silver 2015 Aug 19, 2015 - 10:27 AM GMTBy: Ed_Carlson
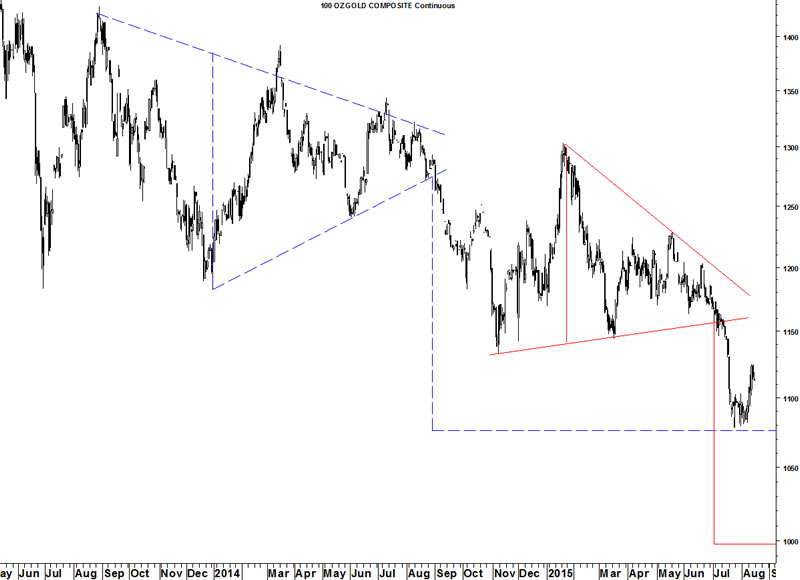
Gold broke out of a small pennant formation on the daily chart last week and gained $18.80/oz. to close the week at $1,112.90. On the weekly chart gold printed an engulfing bullish candlestick. The breakout above 1,100 is bullish but the real test will be a breakout above 1,140. For now, the daily Coppock Curve is rising and has a ways to go before it will signal a top in gold. Cycles point to an important low during July and a rally for all of August. Seasonally, August is very bullish for gold.
Don’t forget that gold moves inversely to the Dollar and I still expect one more rally to a new high by DXY. A triangle forecasts a minimum decline in gold to $1,000 and a 4 year cycle low is not due until the first half of 2016 keeping the long-term outlook bearish.

Try a "sneak-peek" at Lindsay research (and more) at Seattle Technical Advisors.
Ed Carlson, author of George Lindsay and the Art of Technical Analysis, and his new book, George Lindsay's An Aid to Timing is an independent trader, consultant, and Chartered Market Technician (CMT) based in Seattle. Carlson manages the website Seattle Technical Advisors.com, where he publishes daily and weekly commentary. He spent twenty years as a stockbroker and holds an M.B.A. from Wichita State University.
© 2015 Copyright Ed Carlson - All Rights Reserved
Disclaimer: The above is a matter of opinion provided for general information purposes only and is not intended as investment advice. Information and analysis above are derived from sources and utilising methods believed to be reliable, but we cannot accept responsibility for any losses you may incur as a result of this analysis. Individuals should consult with their personal financial advisors.
© 2005-2022 http://www.MarketOracle.co.uk - The Market Oracle is a FREE Daily Financial Markets Analysis & Forecasting online publication.


