


U.S. Election Cycle Stock Market Profit Pattern is About to Begin
Stock-Markets / Stock Markets 2015 Aug 21, 2015 - 03:10 PM GMTBy: ...

MoneyMorning.com  Tom Gentile writes: As much as it pains me to contribute to the thousands of articles mentioning Donald Trump, this one is different…
It's different because I'm going to show you exactly how you can cash in on a concrete pattern, going back three-quarters of a century, which appears across the markets during the "election cycle," or the last two years of every American presidency.
No matter what "The Donald" says or does, no matter who wins, this event has offered savvy investors clockwork profits, and it will do the same for us, too, so it's important to start getting ready now.
Have a look at this chart and you'll see what I mean…
In Donkey vs. Elephant, the Bull Always Wins
My wife and I actually skipped seeing Donald Trump when he was in town recently. Somehow we had VIP access to the candidate and the opportunity to take some pictures.
But rather than join him at the banquet, I decided to stay home to do what I really love doing: poring through gigabytes of data and my proprietary charts.
What I found on this chart that night was way more exciting than any meet-and-greet.
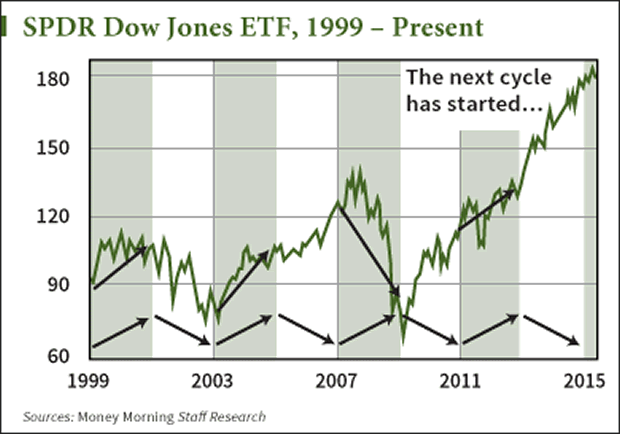
The chart at left shows the monthly performance of the SPDR Dow Jones Industrial Average ETF (NYSE Arca: DIA) going back 16 years.
When you superimpose this over Washington's "work" schedule, the green areas are the last two years of the four-year cycle; it's the time when work stops and campaigning starts.
There has only been one instance where we were heading into the last two years of a four-year presidency that the stock market lost points. And that of course was during the 2007-2008 election cycle, when Republican John McCain was facing off against a young Democrat, Barack Obama.
As we all remember, the stock market was in a rapid free fall at the time due to the meltdown of the global financial system. But… it certainly didn't take long for the pattern to get back on track. The following 2011-2012 cycle saw the pattern return with a vengeance, giving gains of 15%.
This Has Generated Serious Profits Since F.D.R.'s Day
The truth is, this cycle is extraordinarily long-lived, going back 75 years. If you break down the first two years' returns and the last two years' returns, something really interesting arises…
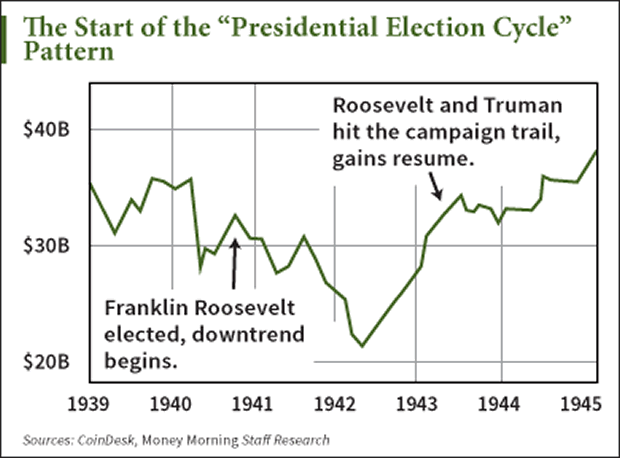
In 1940, we see weakness develop. And then we see strength – and gains – return toward the middle of 1943.
In other words, the first two years are generally weaker than the last two years. It's safe to say that the last two years are where you want to be as an investor by far. That's where the bigger gains live.
November 2015 will start another cycle, so there's still time to get in position to make the trade I'm about to show you.
This Next Pattern Guides the Trade
Also working to our advantage right now is the old "buy in November, go away in May" adage. That's a story in its own right, but the short version is that the stock market trends higher between November and May, and volatility is lower from November to May and higher from May to November.
Now, this pattern doesn't hold up as well as the presidential cycle. In fact, volatility (though it was high all year) didn't start churning until May this year. That doesn't affect the really good prospects of this trade.
What both of these cycles do is give us a set of "rules" to follow to lock in profits on these trades. And we know that rules work much, much better than trading on emotion.
This is a six-month trade where we have exact entry and exit dates. We want to buy into this on Nov. 1, 2015 and hold the trade until May 1, 2016. We'll be put-trading the presidential election cycle pattern right as the November-May cycle pattern starts.
With the Dow Jones Industrial Average now hovering around 17,500, this would be expensive. Even if you were trading the DIA ETF, it would still cost $17,500 for 100 shares.
But we don't need to do that.
You see, though it's not yet time to buy into this pattern, if today were my entry day, the trade would look something like this:
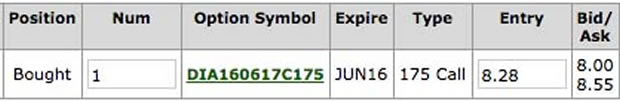
As of today, the cost of owning the DIA June 2016 $175 (DIA160617C175) calls costs just $828, plus fees and commissions. That's a drop in the bucket compared to what the ETF will cost, and you have protection in case of another meltdown, just in case this election cycle treats us to another financial crisis.
The campaign has clearly already begun, and the mud is a-slinging. A lot is going to happen between now and November, so we'll follow this trade in my Power Profit Trades service. Just Click here to get free updates for it, plus access to all my other Power Profit Trades.
I'll be in touch soon.
Source http://moneymorning.com/2015/08/21/profits-start-on-november-1-mark-your-calendar/
Money Morning/The Money Map Report
©2015 Monument Street Publishing. All Rights Reserved. Protected by copyright laws of the United States and international treaties. Any reproduction, copying, or redistribution (electronic or otherwise, including on the world wide web), of content from this website, in whole or in part, is strictly prohibited without the express written permission of Monument Street Publishing. 105 West Monument Street, Baltimore MD 21201, Email: customerservice@moneymorning.com
Disclaimer: Nothing published by Money Morning should be considered personalized investment advice. Although our employees may answer your general customer service questions, they are not licensed under securities laws to address your particular investment situation. No communication by our employees to you should be deemed as personalized investent advice. We expressly forbid our writers from having a financial interest in any security recommended to our readers. All of our employees and agents must wait 24 hours after on-line publication, or after the mailing of printed-only publication prior to following an initial recommendation. Any investments recommended by Money Morning should be made only after consulting with your investment advisor and only after reviewing the prospectus or financial statements of the company.
© 2005-2022 http://www.MarketOracle.co.uk - The Market Oracle is a FREE Daily Financial Markets Analysis & Forecasting online publication.