Sun Rising Over Japanese Stock Market
Stock-Markets / Japanese Stock Market Jun 24, 2008 - 11:10 AM GMT Scanning the globe for investment destinations can be a daunting task. When it comes to stock markets, however, relative strength analysis serves a useful purpose of highlighting under- or outperforming markets (or individual stocks) at a glance. Having perused a bunch of these charts, the Japanese situation stands out as being of particular interest.
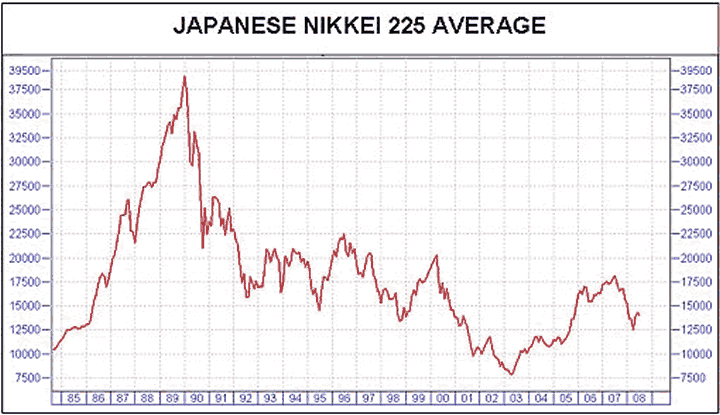
Firstly, let's look at the long-term chart of the Nikkei 225 Average. Japan's stock market had an extended multi-year rally that started in earnest in the 70s and accelerated sharply in the 80s. The Nikkei peaked on December 29, 1989 at 38,915. During the devastating deflationary period that ensued the average dropped by a massive 80.5% to 7,607 on April 28, 2003. The Nikkei staged a recovery from 2003 until 2007 when the sub-prime fallout came into play.

Source: I-Net Bridge
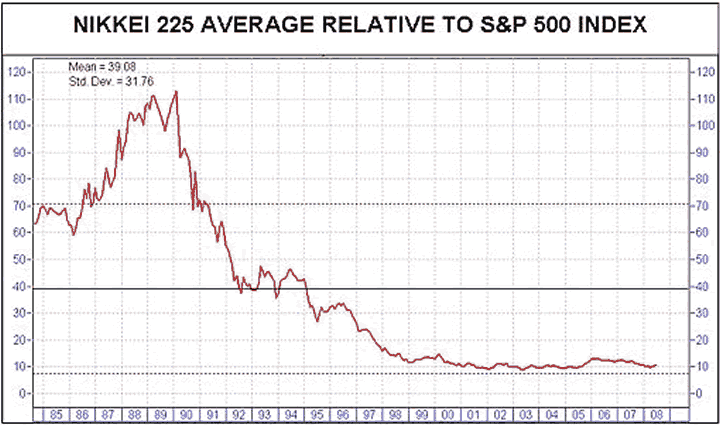
Putting the Nikkei 225's performance in perspective makes for interesting reading, as shown by its relative performance compared with the S&P 500 Index in the chart below. A falling line, which was the case until the end of 2001, depicts Japanese stocks underperforming American stocks. Over the period 2002 to 2008 the relative performance of the Nikkei 225 and S&P 500 mapped out a broad sideways pattern.

Source: I-Net Bridge
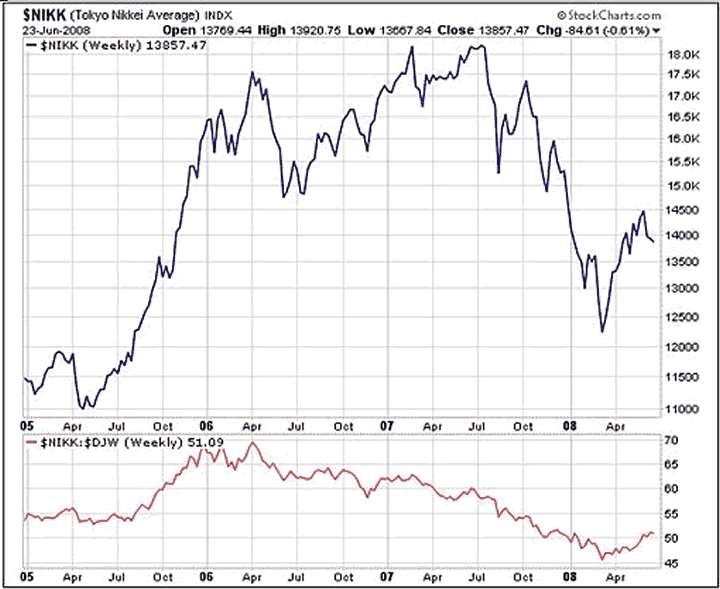
Zeroing in on the shorter term, the Nikkei 225 has underperformed the Dow Jones World Index since the beginning of 2006, underperforming a basket of developed stock markets by 43% until the middle of March this year. But the tables seem to have started turning over the past three months as indicated by the relative strength graph (bottom section) in the graph below.

Source: StockCharts.com
Being cognizant of the fact that we have seen a number of false starts on the relative chart over the past six years, which factors might result in Japanese stocks maintaining their outperformance? David Fuller ( Fullermoney ) argues that there are at least two:
1. Japan is the most efficient user of oil (although Germany is probably a close second).
2. Japan has the lowest inflation rate of any country, but it is likely to rise.
“These two factors could be significant at a time when everyone is understandably concerned about high oil prices and global inflationary problems. However, Japan has the world's highest savings rates, partly due to the long deflation, but the prospect of higher inflation should encourage consumer demand. Also, we often hear about Japan's demographic problems but at least that means fewer poor to feed,” said Fuller.
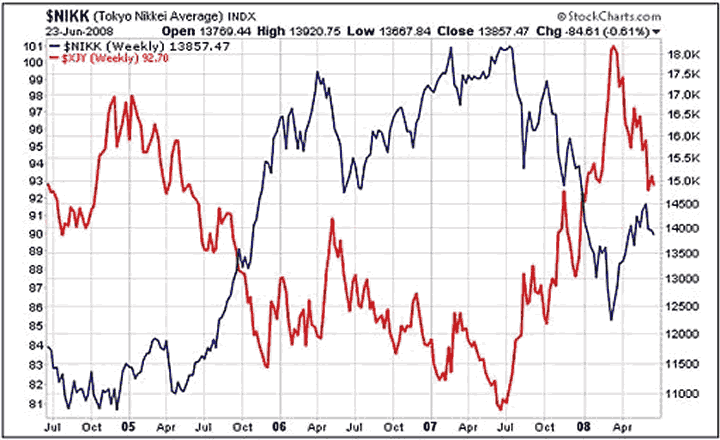
Furthermore, one of the single most important drivers of Japanese equities over the past few years has been the currency as shown by the strong historical inverse relationship between the yen and the Nikkei 225 in the graph below.

The global interest rate outlook is important in trying to assess the outlook for the yen, especially as Japan lays claim to the world's lowest interest rates. With the Federal Reserve on hold for the moment, and with the European Central Bank's Trichet becoming obsessively hawkish, the yen has been under pressure against both the US dollar and euro on the back of expectations of widening interest rate differentials. Also, it is highly unlikely that the Bank of Japan (BoJ) will move rates higher – even with a “hawk” such as Kazuhito Ikeo expected to join the BoJ's rate-setting board.
The weaker yen will help Japanese exporters, just as the weak US dollar has been a boon for their US counterparts.
Japanese stocks will probably not escape the leash effect of Wall Street's bearish sentiment, but should be in a position to better fend off downside risks. I concur with David Fuller who regards Japan as “the best industrialized stock market for today's economic climate”. An equally apt quote comes from a song by In the Groove: “I know that we can make it in the land of the risin' sun!”.
Did you enjoy this posting? If so, click here to subscribe to updates to Investment Postcards from Cape Town by e-mail.
By Dr Prieur du Plessis
Dr Prieur du Plessis is an investment professional with 25 years' experience in investment research and portfolio management.
More than 1200 of his articles on investment-related topics have been published in various regular newspaper, journal and Internet columns (including his blog, Investment Postcards from Cape Town : www.investmentpostcards.com ). He has also published a book, Financial Basics: Investment.
Prieur is chairman and principal shareholder of South African-based Plexus Asset Management , which he founded in 1995. The group conducts investment management, investment consulting, private equity and real estate activities in South Africa and other African countries.
Plexus is the South African partner of John Mauldin , Dallas-based author of the popular Thoughts from the Frontline newsletter, and also has an exclusive licensing agreement with California-based Research Affiliates for managing and distributing its enhanced Fundamental Index™ methodology in the Pan-African area.
Prieur is 53 years old and live with his wife, television producer and presenter Isabel Verwey, and two children in Cape Town , South Africa . His leisure activities include long-distance running, traveling, reading and motor-cycling.
Copyright © 2008 by Prieur du Plessis - All rights reserved.
Disclaimer: The above is a matter of opinion and is not intended as investment advice. Information and analysis above are derived from sources and utilizing methods believed reliable, but we cannot accept responsibility for any trading losses you may incur as a result of this analysis. Do your own due diligence.
Prieur du Plessis Archive |
© 2005-2022 http://www.MarketOracle.co.uk - The Market Oracle is a FREE Daily Financial Markets Analysis & Forecasting online publication.


