


Establishment Survey +173K Jobs, Private Jobs +140,000; U.S. Unemployment Rate 5.1%
Economics / Employment Sep 05, 2015 - 01:11 PM GMTBy: Mike_Shedlock

 The establishment survey came in a weaker than expected 173,000 job. The Bloomberg Consensus estimate was 223,000 jobs.
However, the preceding two months were revised up by 44,000 and wages were strong. Bloomberg provides a nice summation of the strengths and weaknesses.
The headline may not look it but there's plenty of strength in the August employment report. Nonfarm payrolls rose only 173,000 which is at the low-end estimate, but the two prior months are now revised up a total of 44,000. The unemployment rate fell 2 tenths to 5.1 percent which is below the low end estimate and the lowest of the recovery, since April 2008. And wages are strong, with average hourly earnings up 0.3 percent for a 2.2 percent year-on-year rate that's 1 tenth higher than July. Debate will definitely be lively at the September 17 FOMC!
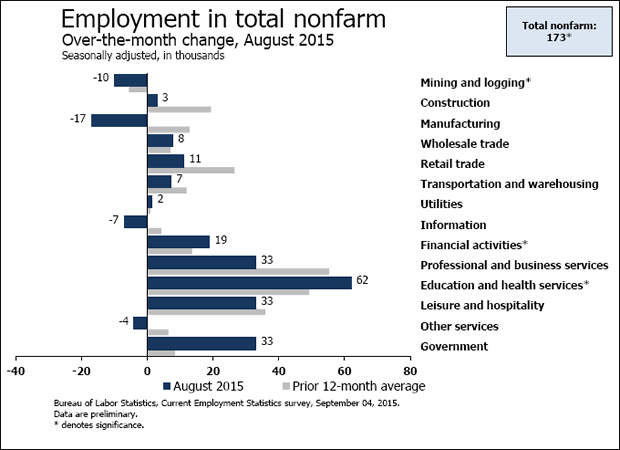
Private payroll growth proved very weak, at only 140,000. Government added 33,000 jobs vs July's 21,000. Manufacturing, held back by weak exports and trouble in energy equipment, shed a steep 17,000 jobs followed by a 9,000 loss for mining which is getting hit by low commodity prices. A plus is a 33,000 rise in professional & business services and a respectable 11,000 rise in the temporary help subcomponent. This subcomponent is considered a leading indicator for long-term labor demand. Retail rose 11,000 with vehicle dealers, who have been very busy, adding 2,000 jobs following July's gain of 11,000.
Seasonality, especially the timing of the beginning of the school year, always plays an outsized role in August employment data which are often revised higher. Policy makers are certain to take this into consideration at this month's FOMC. There's something for everybody in this report which won't likely settle expectations whether the Fed lifts off or not this month.
Revisions
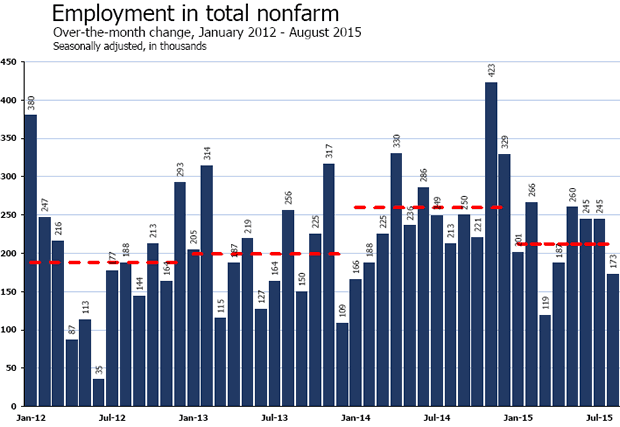
The employment change for June revised up from +231,000 to +245,000, and the change for July revised up from +215,000 to +245,000. Incorporating revisions, employment has increased by an average 221,000 per month over the past 3 months.
Wages
Average hourly earnings for all employees on private, nonfarm payrolls rose by 8 cents in August, following a 6-cent gain in July. Hourly earnings are up 2.2 percent over the year. In August, average weekly hours of all employees edged up 0.1 hour to 34.6 hours.
BLS Jobs Statistics at a Glance
- Nonfarm Payroll: +173,000 - Establishment Survey
- Employment: +196,000 - Household Survey
- Unemployment: -33,000 - Household Survey
- Involuntary Part-Time Work: +158,000 - Household Survey
- Voluntary Part-Time Work: -131,000 - Household Survey
- Baseline Unemployment Rate: -0.2 to 5.1% - Household Survey
- U-6 unemployment: -0.1 to 10.3% - Household Survey
- Civilian Non-institutional Population: +220,000
- Civilian Labor Force: -41,000 - Household Survey
- Not in Labor Force: +261,000 - Household Survey
- Participation Rate: +0.0 to 62.6 - Household Survey
August 2015 Employment Report
Please consider the Bureau of Labor Statistics (BLS) Current Employment Report.
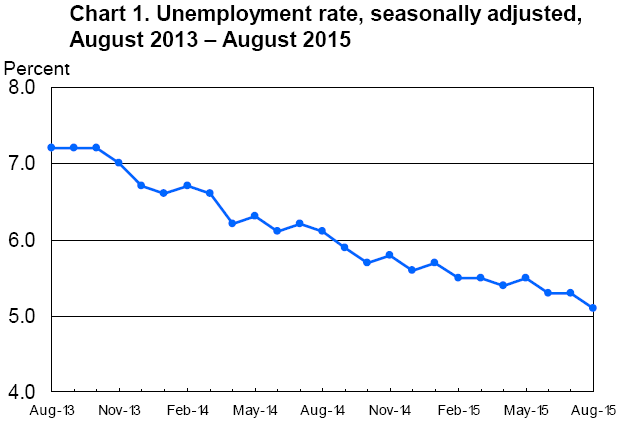
Total nonfarm payroll employment increased by 173,000 in August, and the unemployment rate edged down to 5.1 percent. Job gains occurred in health care and social assistance and in financial activities. Manufacturing and mining lost jobs.
Unemployment Rate - Seasonally Adjusted
Nonfarm Employment
Nonfarm Employment Change from Previous Month by Job Type
Hours and Wages
Average weekly hours of all private employees rose by 0.1 hours to 34.6 hours (from a downward revision of 34.5 hours last month) . Average weekly hours of all private service-providing employees was flat at 33.4 hours.
Average hourly earnings of production and non-supervisory private workers rose $0.05 at $21.07. Average hourly earnings of production and non-supervisory private service-providing employees rose $0.06 at $20.88.
For discussion of income distribution, please see What's "Really" Behind Gross Inequalities In Income Distribution?
Birth Death Model
Starting January 2014, I dropped the Birth/Death Model charts from this report. For those who follow the numbers, I retain this caution: Do not subtract the reported Birth-Death number from the reported headline number. That approach is statistically invalid. Should anything interesting arise in the Birth/Death numbers, I will add the charts back.
Table 15 BLS Alternate Measures of Unemployment
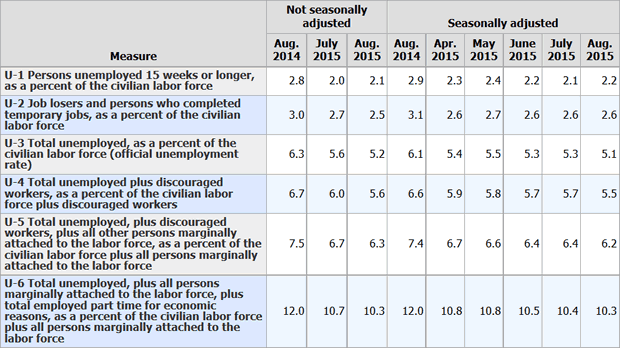
Table A-15 is where one can find a better approximation of what the unemployment rate really is.
Notice I said "better" approximation not to be confused with "good" approximation.
The official unemployment rate is 5.1%. However, if you start counting all the people who want a job but gave up, all the people with part-time jobs that want a full-time job, all the people who dropped off the unemployment rolls because their unemployment benefits ran out, etc., you get a closer picture of what the unemployment rate is. That number is in the last row labeled U-6.
U-6 is much higher at 10.3%. Both numbers would be way higher still, were it not for millions dropping out of the labor force over the past few years.
Some of those dropping out of the labor force retired because they wanted to retire. The rest is disability fraud, forced retirement, discouraged workers, and kids moving back home because they cannot find a job.
By Mike "Mish" Shedlock
http://globaleconomicanalysis.blogspot.com
Click Here To Scroll Thru My Recent Post List
Mike Shedlock / Mish is a registered investment advisor representative for SitkaPacific Capital Management . Sitka Pacific is an asset management firm whose goal is strong performance and low volatility, regardless of market direction.
Visit Sitka Pacific's Account Management Page to learn more about wealth management and capital preservation strategies of Sitka Pacific.
I do weekly podcasts every Thursday on HoweStreet and a brief 7 minute segment on Saturday on CKNW AM 980 in Vancouver.
When not writing about stocks or the economy I spends a great deal of time on photography and in the garden. I have over 80 magazine and book cover credits. Some of my Wisconsin and gardening images can be seen at MichaelShedlock.com .
© 2015 Mike Shedlock, All Rights Reserved.
Disclaimer: The above is a matter of opinion provided for general information purposes only and is not intended as investment advice. Information and analysis above are derived from sources and utilising methods believed to be reliable, but we cannot accept responsibility for any losses you may incur as a result of this analysis. Individuals should consult with their personal financial advisors.
Mike Shedlock Archive |
© 2005-2022 http://www.MarketOracle.co.uk - The Market Oracle is a FREE Daily Financial Markets Analysis & Forecasting online publication.