Here's Your Insurance Against a $200 Trillion Debt Bubble Crash
Interest-Rates / Global Debt Crisis 2015 Sep 08, 2015 - 10:35 AM GMTBy: ...
MoneyMorning.com Peter Krauth writes: The world is awash in debt, and it's simply unsustainable. As worldwide debt levels keep setting new records, there's no chance anyone will ever be paid back.
Even "vampire squid" Goldman Sachs Group Inc. (NYSE: GS), with its tentacles deep into bond markets, thinks so.
The world's central banks now have an insurmountable dilemma: Raising interest rates will just increase the repayment burden. Keeping them low will only inflate the debt bubbles all over.
The sovereign debt crises we've seen over the last six years have triggered major sell-offs, but odds are high this $200 trillion global problem could start the mother of them all.
But I'm going to show you how to make a killing as the bill comes due…
Government Debt Is the "Bubbliest" of All

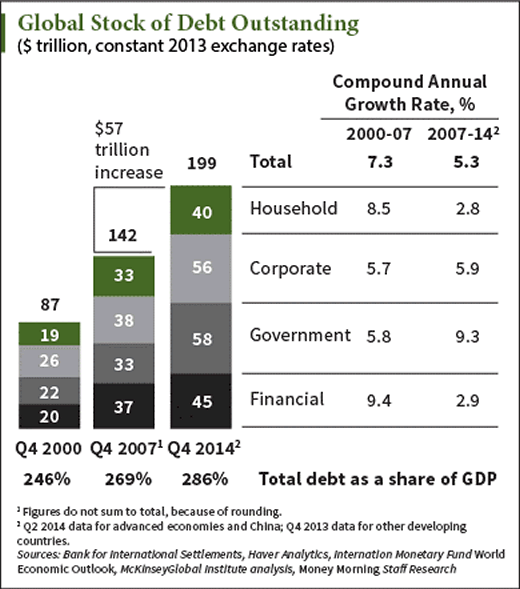
Global debt has mushroomed by $57 trillion since the financial crisis, and that's only up to the end of 2014.
You can see that government debt, mostly accrued in an effort to stimulate the developed world's floundering economies, accounts for the lions' share of this astronomical bill.
One of the most salient points of this chart is that while debt is up by a stunning 40% since 2007, the world has gone from debt at an already massive 246% of GDP in 2000 to 286% of GDP in 2014.

And how have we benefitted? We haven't.
Economic output has clearly not kept pace with all this extra debt.
Even St. Louis Fed Vice President Stephen D. Williamson admitted in a recent white paper that the theory behind quantitative easing (QE) is "not well-developed."
He suggests that empirical support for Bernanke's view on how asset purchases affect outcomes is "mixed at best."
Williamson considers all the relevant research to be problematic and says that "there is no way to determine whether asset prices move in response to a QE announcement simply because of a signaling effect, whereby QE matters not because of the direct effects of the asset swaps, but because it provides information about future central bank actions with respect to the policy interest rate."
No research has established a link between QE and the goal of inflation and the stimulation of economic activity.
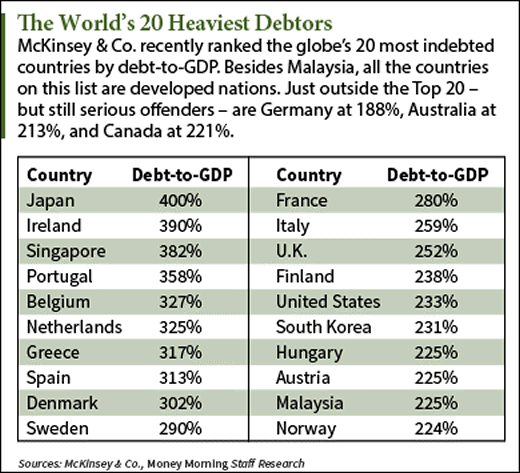
Japan is perhaps the best example for this phenomenon, given its head start on multiple lost decades in its stock market and dire demographic outlook.
That was proved when its central bank went "all-in" to once again try and kick start economic activity through a mega-QE program at a mind-blowing pace of $712 billion annually, announced last October.
Sorry, Abe and Kuroda; inflation in your country was still at zero in July over the previous 12 months, well below the official 2% target.
There's No Way to Pay the Debt Back
The world's $200 trillion debt is almost three times annual economic output.
In my view, there is major risk of a knock-on effect from all this accumulating debt. The biggest risk could come in the form of another sovereign debt crisis.
Jeremy Grantham of investment firm Grantham, Mayo, van Otterloo & Co. LLC (GMO), with $118 billion under management, thinks so too.
Grantham gave advance warnings for both the 2000 and 2008 market crashes and thinks the United States is just asking for another such event – as soon as next year.
He's worried that could trigger something approaching the Great Depression, with a wave of government defaults that "might just break the system."
The greatly increased risk of a popping debt bubble leading to a major market sell-off highlights the value of looking at portfolio insurance.
Hedge Against Volatility with These "Insurance" Plays
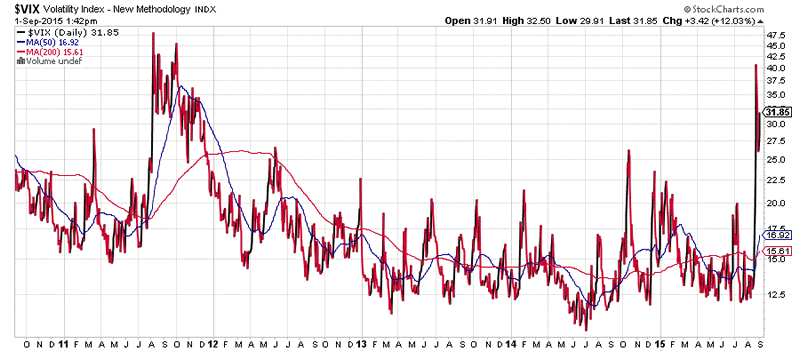
As a result of the Sept. 1 flash sell-off, the Chicago Board of Options Exchange Volatility Index (VIX) shot up from around 12 to 40 – not as high as the 53.29 it hit during the Aug. 24 crash, but still astronomical.

The last time it reached those levels was, not coincidentally, in late 2011 when the markets last had a pronounced correction.

To hedge against this kind of severe volatility, consider using some of these exchange-traded funds (ETFs).
For short-term futures, consider the iPath S&P 500 VIX Short Term Futures ETN (NYSE Arca: VXX). It trades a whopping 65 million shares daily, so it's extremely liquid. Exposure is to a rolling long position in the first and second month VIX futures contracts, which reflects the implied volatility of the S&P 500.
For mid-term futures, consider the iPath S&P 500 MT Futures ETN (NYSE Arca: VXZ). It trades a respectable 500,000 shares daily. Exposure is to long positions in fourth, fifth, sixth and seventh month VIX futures.
In both cases, there is a structural bias that resets thanks to decaying futures premiums. When markets are volatile, these ETFs can underperform their underlying index.
Alternately, you can look to buy naked puts on the S&P 500. The potential payoff is high – but note this is a very speculative, high-risk strategy that can open the door to steep losses. Only do this if you're comfortable with the idea and it fits your risk tolerance.
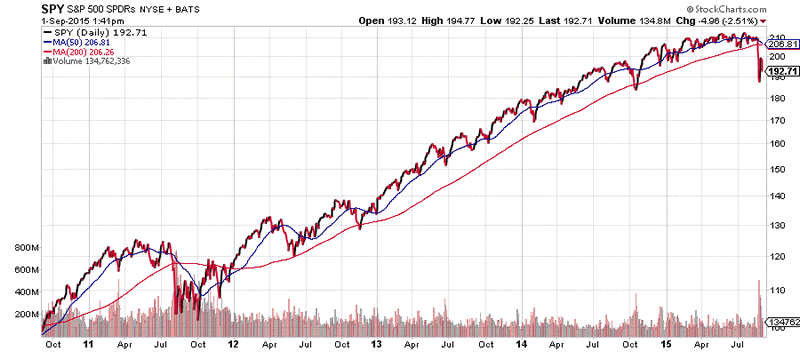
The reference vehicle for these puts would be the SPDR S&P 500 ETF (NYSE Arca:SPY).
For example, if you expect a markedly lower S&P 500 within the next 12 months, you can consider the SPY September 16 2016 $150 (SPY160916P00150000) puts. With the SPY currently around $190, these are only in the money if the S&P 500 drops by over 21%.
If you want the comfort of a farther out expiration date, consider the SPY December 15 2017 $160 (SPY171215P00160000) puts. These are only in the money if the S&P 500 drops by over 17%, but they are pricier thanks to the embedded value of their later expiry.
In any case, consider how much of a drop in value you want to protect your portfolio against. Also, keep in mind that options are cheaper when volatility is low, so the best time to acquire them is when markets are quiet.
Remember, calm will return, but like last week, something will come along to upset the apple cart once again. Odds are another sovereign debt crisis will be the trigger, and it could get really ugly.
Some downside protection would be very valuable at that point. The time to shop for that insurance is when others become complacent once again.
Follow us on Twitter ;@moneymorning.
Source http://moneymorning.com/2015/09/08/heres-your-insurance-against-a-200-trillion-debt-bubble/
Money Morning/The Money Map Report
©2015 Monument Street Publishing. All Rights Reserved. Protected by copyright laws of the United States and international treaties. Any reproduction, copying, or redistribution (electronic or otherwise, including on the world wide web), of content from this website, in whole or in part, is strictly prohibited without the express written permission of Monument Street Publishing. 105 West Monument Street, Baltimore MD 21201, Email: customerservice@moneymorning.com
Disclaimer: Nothing published by Money Morning should be considered personalized investment advice. Although our employees may answer your general customer service questions, they are not licensed under securities laws to address your particular investment situation. No communication by our employees to you should be deemed as personalized investent advice. We expressly forbid our writers from having a financial interest in any security recommended to our readers. All of our employees and agents must wait 24 hours after on-line publication, or after the mailing of printed-only publication prior to following an initial recommendation. Any investments recommended by Money Morning should be made only after consulting with your investment advisor and only after reviewing the prospectus or financial statements of the company.
© 2005-2022 http://www.MarketOracle.co.uk - The Market Oracle is a FREE Daily Financial Markets Analysis & Forecasting online publication.


