


Lumber Looking Lousy
Commodities / Lumber Sep 12, 2015 - 04:22 PM GMTBy: Austin_Galt

 Lumber is looking pretty lousy at the moment hitting new yearly lows recently. Price has been trading as laid it in previous analysis so let's update the situation using the monthly and weekly charts.
Lumber Monthly Chart
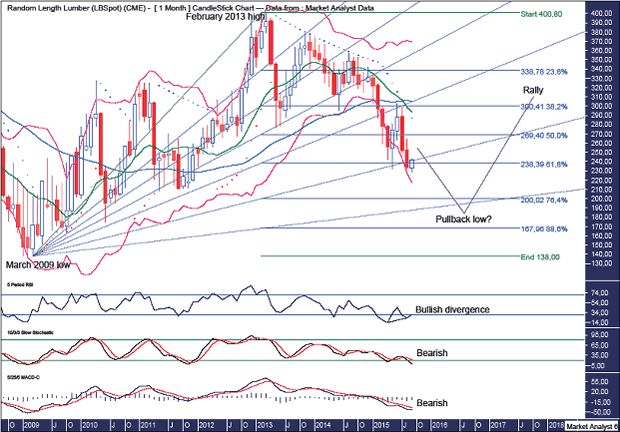
The Fibonacci Fan shows price found support at the 76.4% angle and rallied up to the 61.8% angle where resistance came in and price subsequently dropped to new yearly lows.
Price is now back around support from the 76.4% angle and there are two possibilities I see going forward. The first scenario is price mills around this 76.4% angle before the downtrend resumes. The second scenario is a more substantial rally occurs which sees price get back up to the 61.8% angle whereby resistance would likely come in again. Both scenarios ultimately see the downtrend resumes and head to final lows around support from the 88.6% angle.
I have added Fibonacci retracement levels of the move up from March 2009 low to February 2013 high. Price is now back at support given from the 61.8% level and it is possible to see another big bounce from here. Regardless of how big the bounce, my final target for low remains at least the 76.4% level at $200 and probably a bit lower. The 88.6% level at $167 is not out of the question but I don't favour that low.
The PSAR indicator currently has a bearish bias and held the recent bear rally. A big bounce now would likely bust this resistance thereby reducing some of the negativity and setting price up for the final move into low. Price may also turn down again without busting this resistance which will mean the final low is dead ahead.
The Bollinger Bands show the recent rally was at resistance from the middle band. Price is now back at the lower band and the question now is does price continue down hugging the lower band or is one last rally back to the middle band on the cards? Breaking to new lows now would likely mean the former scenario is playing out.
The RSI set up a bullish divergence on the new price low which indicates a big bounce may be on the cards.
The Stochastic and MACD indicators are bearish but both have been trending down for quite a while so a multi-month rally would certainly not surprise.
Also, the 50 period moving average (blue) has just made a bearish crossover of the 14 period moving average (green) so the overall picture is bearish. However, these bearish crossovers are often followed by bear rallies.
Let's move on to the weekly chart.
Lumber Weekly Chart
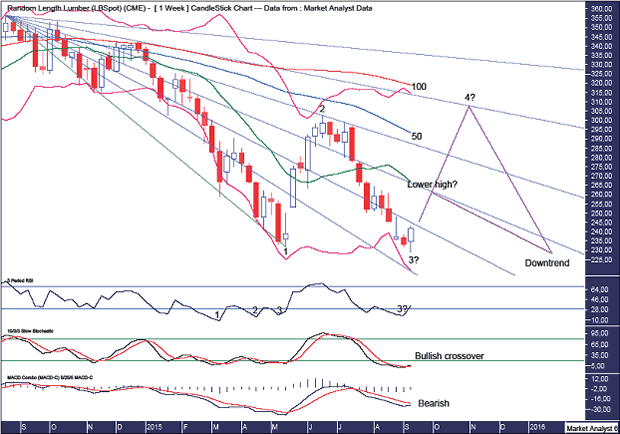
The recent rally came after a triple bullish divergence on the RSI. Price has now made a new price low which still sets up a triple bullish divergence on the longer time frame so a big bounce now would fit going by this indicator.
The Stochastic indicator shows a recent bullish crossover.
The MACD indicator is still bearish but that would obviously change if a big rally occurs. This new price low looks to be setting up a bullish divergence.
The 100 period moving average (red) is above the 50 period moving average (blue) indicating the overall bearishness of the trend.
The Bollinger Bands show the recent high at resistance from the upper band with price now back down at the lower band. I favour a rally now with price getting back to the middle band and possibly another lash at the upper band.
I have drawn a Fibonacci Fan which shows the recent rally high was at resistance from the 61.8% angle. These angles should provide resistance as any price rally develops.
Finally, there is the potential for a 5 point broadening low to develop. This would mean we already have points 1, 2 and 3 in place and price is now headed up to a new rally high which would be the point 4 high. (Perhaps that would be at resistance from the 76.4% angle?). After that, the downtrend should resume which sees price crack to new yearly lows once again.
It is also possible that price heads up now to put in a lower high before the downtrend resumes.
So, which scenario do I prefer - a lower high or a point 4 high?
Well, I personally favour the 5 point broadening low scenario. However, that is just my personal opinion and how price behaves going forward from here may see that opinion change!
Summing up, while things are looking pretty lousy at the moment, there may be some temporary respite going forward.
By Austin Galt
Austin Galt is The Voodoo Analyst. I have studied charts for over 20 years and am currently a private trader. Several years ago I worked as a licensed advisor with a well known Australian stock broker. While there was an abundance of fundamental analysts, there seemed to be a dearth of technical analysts. My aim here is to provide my view of technical analysis that is both intriguing and misunderstood by many. I like to refer to it as the black magic of stock market analysis.
Email - info@thevoodooanalyst.com
© 2015 Copyright The Voodoo Analyst - All Rights Reserved
Disclaimer: The above is a matter of opinion provided for general information purposes only and is not intended as investment advice. Information and analysis above are derived from sources and utilising methods believed to be reliable, but we cannot accept responsibility for any losses you may incur as a result of this analysis. Individuals should consult with their personal financial advisors.
Austin Galt Archive |
© 2005-2022 http://www.MarketOracle.co.uk - The Market Oracle is a FREE Daily Financial Markets Analysis & Forecasting online publication.