


Stock Market Primary IV Continues
Stock-Markets / Stock Markets 2015 Sep 12, 2015 - 04:49 PM GMTBy: Tony_Caldaro

 The holiday shortened week started at SPX 1921. After a Tuesday morning, and Wednesday morning, gap up opening the SPX hit 1989. The market then declined to SPX 1937 by Thursday morning. Then the market rallied again to end the week at SPX 1961. For the week the SPX/DOW were +2.05%, the NDX/NAZ were +2.15%, and the DJ World index was +2.05%. Economic reports for the week were mostly negative. On the uptick: consumer credit, plus weekly jobless claims and the budget deficit improved. On the downtick: the WLEI, export/import prices, wholesale inventories, consumer sentiment and long term investor sentiment. Next week will be highlighted by the FOMC, Industrial production, and Options expiration.
LONG TERM: bull market
For the past two weeks we have noted in the weekend report about a potential bear market signal should we get a long term downtrend confirmation. Thus far this has not occurred. However, everyone should have considered this potential event, and by now have taken the necessary precautions in case it is triggered. Until it is we continue we our preferred count of an ongoing bull market.
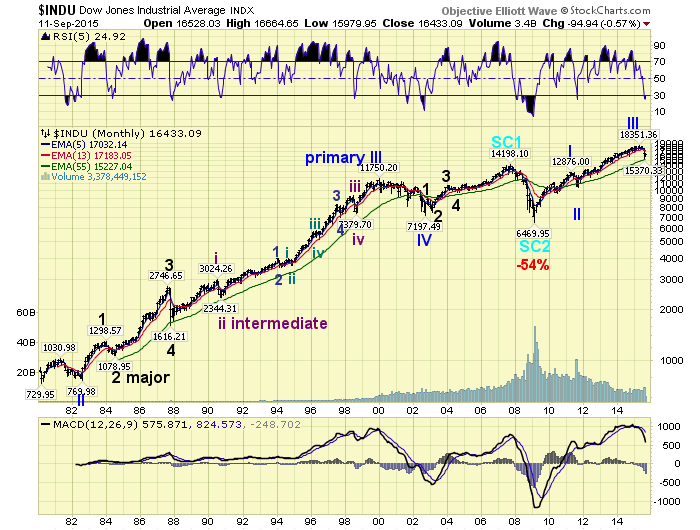
To put the recent selloff into a much longer term perspective a review of the monthly DOW chart is in order. From 1982-2000 the DOW completed a very long Primary III, of Cycle wave [5] from 1974. This occurred nearing the end of Super Cycle 1. So do not get it confused with the current bull market, which is at the beginning of Super cycle 3. During that period of time Major waves 2 and 4 were OEW quantified bear markets, after short Major 1 and 3 bull markets. Major wave 5, the bull market that followed, lasted for 13 years.
Notice, during Major waves 2 and 4, in 1984 and 1987, the RSI 5 got oversold. Since the prior bull markets were short, 2 and 3 years, the RSI never got close to being oversold. During Major wave 5, a 13 year bull market, the RSI got oversold only twice: during 1990 and during 1998. Notice both times it did get oversold were at waves 2 and 4 of that long bull market. During that entire 18 year rise, 1982-2000, the only time the RSI got oversold was during the second and fourth waves of significant degree. When we review Primary V, the 2002-2007 bull market, the RSI never got oversold.
Currently we are in a lengthy six year bull market. Notice that the RSI has been oversold twice: 2011 and 2015. Also notice we have a Primary II label at the 2011 low, and are expecting to place a Primary IV label when the current correction concludes. Thirty-five years of DOW monthly data, consistently displays the RSI only gets oversold at significant second and fourth waves. It certainly looks like Primary wave V will be next.
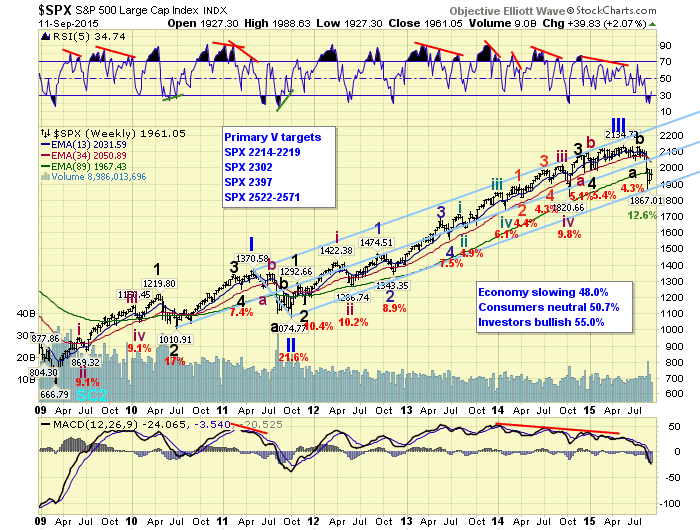
On the SPX weekly chart it is best to look at the slower moving MACD to observe similar oversold conditions. The two largest declines have occurred during what we are labeling Primary waves II and IV. Again suggesting there will be a Primary V higher. Since Primary II was an elongated flat: abA-B-C, Primary IV should be something simpler like as zigzag: A-B-C. Since A and B have already completed we are simply awaiting the confirmation that C has ended as well. After that Primary V should take this bull market to new highs.
MEDIUM TERM: downtrend
The daily chart displays the Primary III high at SPX 2135. Then a Major wave A low at SPX 2044, and a slightly lower high for Major wave B at SPX 2133. After that the market went sideways for a few weeks, then went into a volatile four day decline to SPX 1867. Then after an oversold rally to SPX 1993 the market has stayed within that range for the past two weeks.
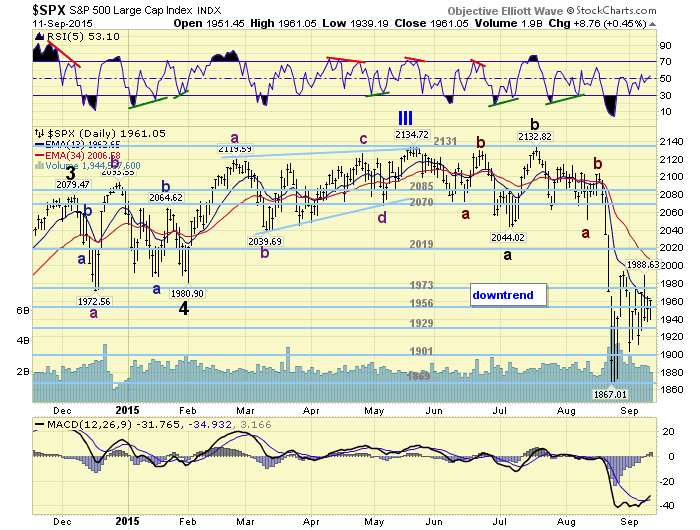
We continue to count the sideways activity as Intermediate waves A and B at SPX 2052 and 2103, with Int. C underway. Intermediate C then divides into three Minor waves. Minor wave A at SPX 1867, then Minor B either completed at 1993 or still ongoing. When this counter trend rally does conclude we would expect that SPX 1867 level to be retested. This suggests a potential Primary IV low at the 1828, 1841 or 1869 pivots. Ideally the market should continue in the current choppy range giving the daily MACD a chance to recover. Then spike down into the final low setting up a positive divergence in both the RSI and MACD. Medium term support is at the 1956 and 1929 pivots, with resistance at the 1973 and 2019 pivots.
SHORT TERM
We continue to maintain the count described above on the SPX hourly chart. Currently we have Minor B ending at SPX 1993. However, due to the choppy and range bound activity since that high it may not be done yet. We have monitored the recent choppy activity, but every time it appears to be taking one form it shifts into another. We will just let it play itself out, like in 2011. Overall all the rallies from the SPX 1867 low continue to look corrective.
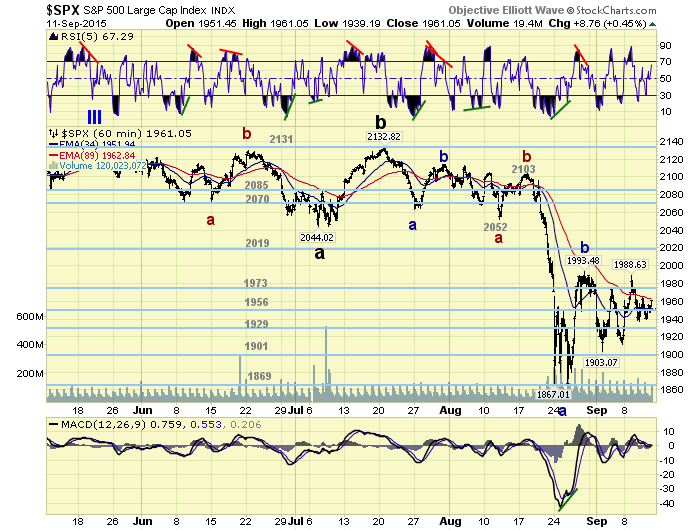
Short term support is at the 1956 and 1929 pivots, with resistance at the 1973 pivot and SPX 1993. Short term momentum ended the week just below overbought. Best to your weekend, and interesting week ahead.
FOREIGN MARKETS
The Asian markets were mostly higher gaining 1.5% on the week.
European markets were also mostly higher gaining 1.1%.
The Commodity equity group was mixed and gained 0.1%.
The DJ World index is still in a downtrend but gained 2.05%.
COMMODITIES
Bonds are weakening and lost 0.6% on the week.
Crude is still trying to uptrend but lost 2.5%.
Gold is weakening again and lost 1.7%.
The USD continues its downtrend and lost 1.1%.
NEXT WEEK
Tuesday: Retail sales, the NY FED and Industrial production. Wednesday: the CPI and the NAHB. Thursday: weekly Jobless claims, Housing starts, Building permits, the Philly FED, and the FOMC concludes. Friday: Leading indicators and Options expiration. Should be an interesting week!
CHARTS: http://stockcharts.com/public/1269446/tenpp
After about 40 years of investing in the markets one learns that the markets are constantly changing, not only in price, but in what drives the markets. In the 1960s, the Nifty Fifty were the leaders of the stock market. In the 1970s, stock selection using Technical Analysis was important, as the market stayed with a trading range for the entire decade. In the 1980s, the market finally broke out of it doldrums, as the DOW broke through 1100 in 1982, and launched the greatest bull market on record.
Sharing is an important aspect of a life. Over 100 people have joined our group, from all walks of life, covering twenty three countries across the globe. It's been the most fun I have ever had in the market. Sharing uncommon knowledge, with investors. In hope of aiding them in finding their financial independence.
Copyright © 2015 Tony Caldaro - All Rights Reserved Disclaimer: The above is a matter of opinion provided for general information purposes only and is not intended as investment advice. Information and analysis above are derived from sources and utilising methods believed to be reliable, but we cannot accept responsibility for any losses you may incur as a result of this analysis. Individuals should consult with their personal financial advisors.
Tony Caldaro Archive |
© 2005-2022 http://www.MarketOracle.co.uk - The Market Oracle is a FREE Daily Financial Markets Analysis & Forecasting online publication.